Use Cases & ROI Examples
This document explores real-world use cases for AWS Lens across different organizational roles and scenarios, with concrete examples of value delivered and ROI achieved.
Table of Contents
- For Finance & Executive Leadership
- For FinOps & Cloud Cost Teams
- For Engineering & DevOps
- For Enterprise Architects
- Industry-Specific Use Cases
- ROI Calculator & Business Case
For Finance & Executive Leadership
Use Case 1: Monthly Cloud Cost Visibility & Forecasting
Challenge: A global e-commerce company was spending $2.4M/month on AWS but lacked real-time visibility. Finance only learned of overspend after month-end when AWS invoice arrived, making it impossible to take corrective action.
Solution with AWS Lens:
-
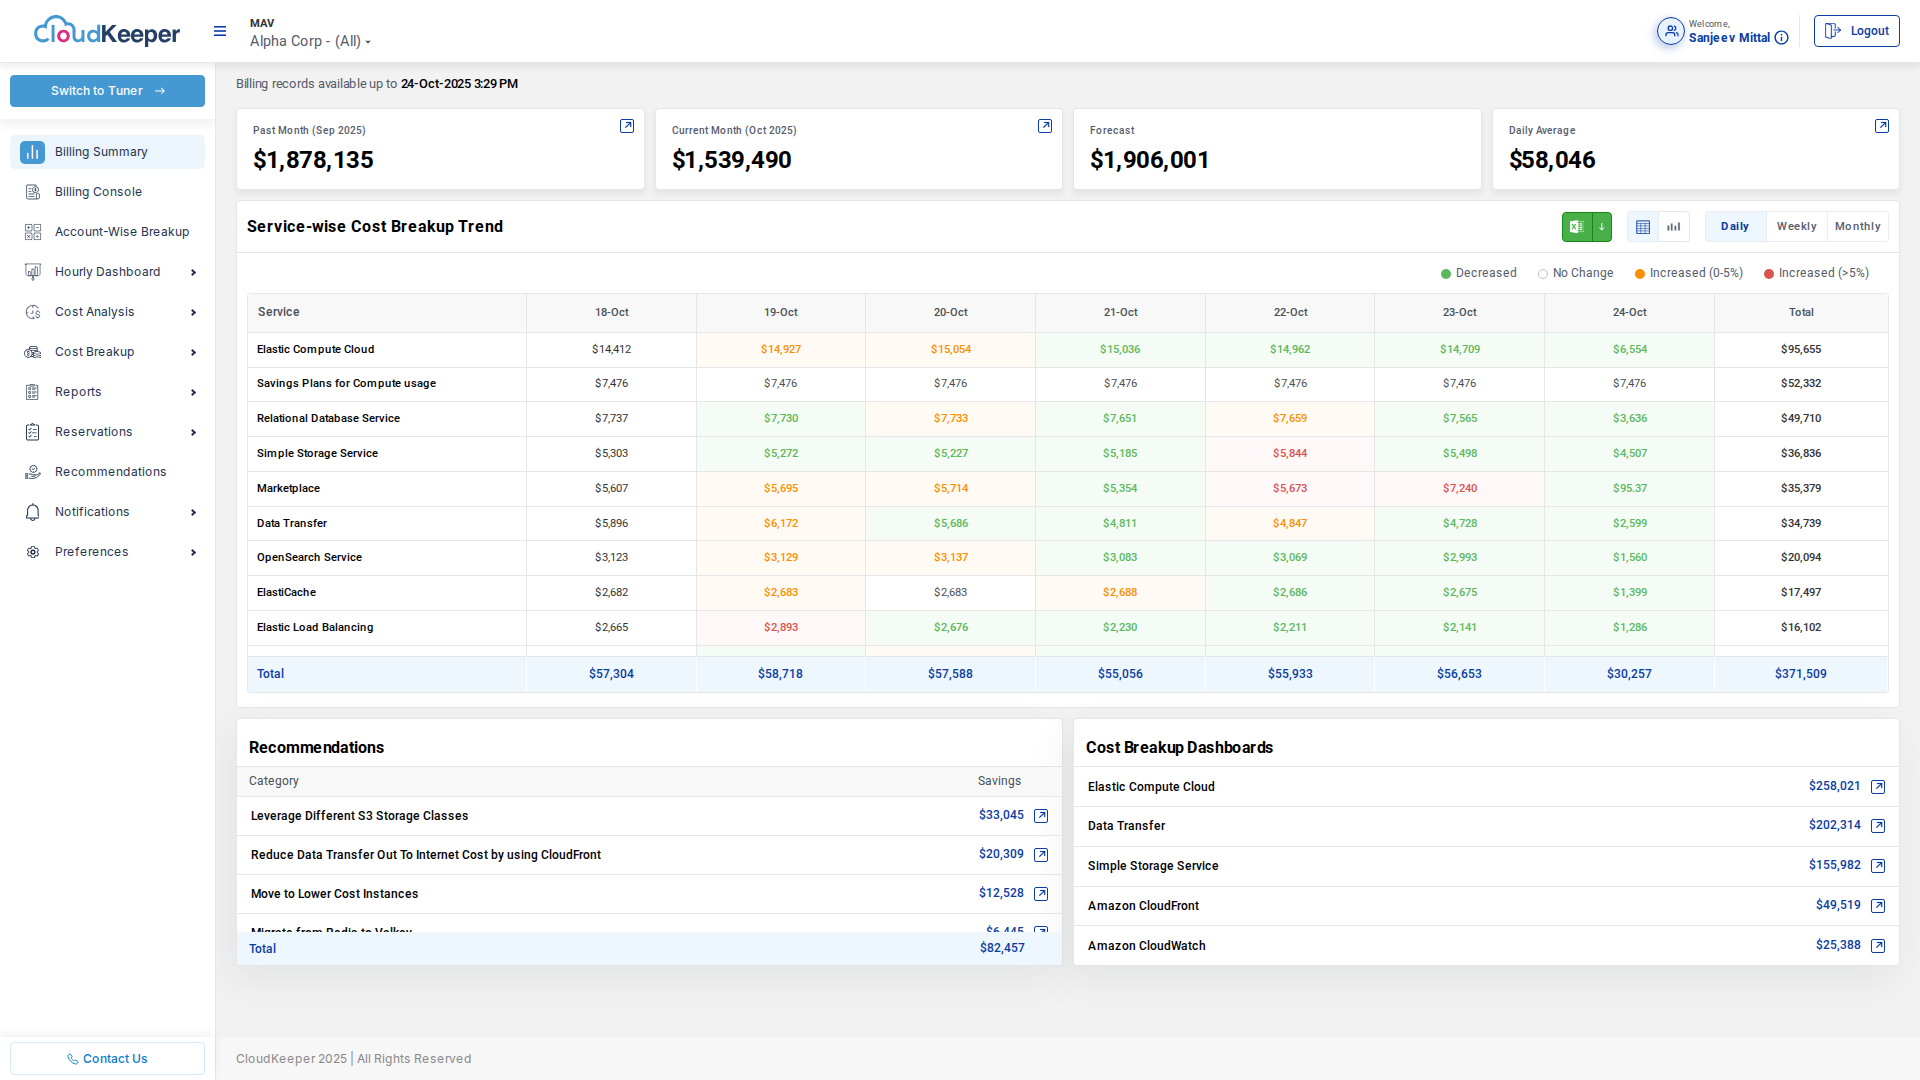
Real-Time Dashboard: Finance team gets instant access to current month spend
Current Month: $1,539,490 (as of Oct 24)
Forecast: $1,906,001 (projected month-end)
Daily Average: $58,046 -
Early Warning System: Forecast shows projected month-end spend 3 weeks before month-end
- If forecast > budget, trigger immediate optimization efforts
- If forecast < budget, consider infrastructure investments
-
Daily Monitoring: Finance reviews dashboard every morning (2 minutes)
- Identify unusual spikes immediately
- Contact engineering for explanations within hours, not weeks
Results:
- Avoided $180K overrun in Q1 by catching cost spike 2 weeks early
- Improved forecast accuracy from ±25% to ±5%
- Reduced finance team time from 40 hours/month to 5 hours/month
ROI:
- Tool cost: $2,000/month
- Time saved: 35 hours × $75/hour = $2,625/month
- Overrun avoided: $180K one-time + $30K/quarter ongoing
- First quarter ROI: 3,000%
Use Case 2: Executive Board Reporting
Challenge: SaaS company needed to report cloud costs as % of revenue to board of directors, but data was scattered across AWS Cost Explorer, spreadsheets, and finance systems.
Solution with AWS Lens:
-
Automated Monthly Report: Scheduled report delivered 1st of each month
- Total AWS spend
- Year-over-year growth
- Cost per customer (AWS spend / customer count)
- Gross margin impact
-
Trend Visualization: 12-month rolling chart showing AWS spend as % of revenue
- Target: Keep below 15% of revenue
- Alert if approaching 16%
-
Cost Breakdown: Show where money is going
- Production: 70%
- Staging: 15%
- Development: 10%
- Other: 5%
Results:
- Board confidence: Data-driven reporting shows cloud spend under control
- Strategic decisions: Identified that cost/customer was decreasing (good unit economics)
- Competitive advantage: Lower cloud costs = better gross margins vs competitors
ROI:
- Previously: CFO + analyst spent 12 hours/month preparing report
- Now: Automated report + 1 hour review
- Time saved: 11 hours × $150/hour = $1,650/month
- Plus: Better data enables better decisions (hard to quantify but substantial)
Use Case 3: M&A Due Diligence
Challenge: Private equity firm acquiring a cloud-native company needed to understand true cloud costs and identify optimization opportunities to improve EBITDA post-acquisition.
Solution with AWS Lens:
-
Rapid Assessment: Connected target company's AWS accounts to AWS Lens (read-only)
-
30-Day Analysis:
- Current spend: $450K/month
- Identified immediate optimizations: $135K/month (30%)
- Projected optimized spend: $315K/month
-
Due Diligence Report:
- Current vs optimal spend
- Benchmark against similar companies (spend per user, per transaction)
- 100-day optimization plan post-acquisition
Results:
- Valuation adjustment: Reduced purchase price by $2M based on inefficient cloud usage
- Post-acquisition: Achieved $120K/month savings within 90 days
- EBITDA improvement: $1.4M annually (directly impacts company valuation)
ROI:
- Due diligence cost: $5,000
- Savings discovered: $135K/month × 12 = $1.62M/year
- ROI: 32,000%
For FinOps & Cloud Cost Teams
Use Case 4: Chargeback & Showback Implementation
Challenge: Fortune 500 company with 15 business units and 200+ AWS accounts needed to allocate $8M/year cloud spend back to business units for accountability.
Solution with AWS Lens:
-
Tag Enforcement:
- Required tags: BusinessUnit, CostCenter, Environment, Owner
- AWS Lens identified 45% of resources untagged
- Auto-remediation: Assigned tags based on account mapping
-
Automated Chargeback Reports:
Monthly Report by Business Unit:
- Engineering: $3.2M (40%)
- Operations: $2.4M (30%)
- Data Science: $1.6M (20%)
- QA: $400K (5%)
- Marketing: $400K (5%) -
Drill-Down Visibility: Each business unit can see their own costs by:
- Service (which AWS services they use)
- Environment (production vs non-production)
- Team (sub-allocate within business unit)
- Project (track project-specific spend)
Results:
- Accountability: Business units now manage their own cloud budgets
- Cost awareness: Development teams started asking "how much will this cost?" before deploying
- Waste reduction: Each business unit reduced non-prod costs by 25% once they could see them
- Savings: $600K/year from increased accountability alone
ROI:
- Implementation effort: 2 weeks
- Tool cost: $3,000/month
- Savings: $600K/year (from accountability) + $300K/year (from right-sizing) = $900K/year
- ROI: 2,400%
Use Case 5: Budget Management & Anomaly Detection
Challenge: Healthcare SaaS company with $500K/month AWS spend experienced frequent unexpected cost spikes that blew budgets, causing internal friction between finance and engineering.
Solution with AWS Lens:
-
Budget Configuration:
- Set monthly budget: $500K
- Alert thresholds: 75% ($375K), 90% ($450K), 100% ($500K)
- Alert recipients: FinOps manager, VP Engineering, CFO
-
Anomaly Detection:
- Baseline: Average daily spend $16,500
- Anomaly threshold: 20% above baseline ($19,800/day)
- Alert on anomalies with details: which service, which account, which region
-
Real Example:
Alert: CloudFront costs spiked to $15K on Oct 18 (normally $2K)
Root cause: Marketing campaign went viral, 10x traffic
Action: Acceptable cost (drove revenue), but now monitored
Results:
- Early detection: Caught runaway Lambda function within 2 hours (cost $800, would have been $9,600 if run full day)
- Budget compliance: Haven't exceeded monthly budget in 6 months (previously exceeded 4/12 months)
- Peace of mind: Engineering can innovate without fear of surprise costs
ROI:
- Avoided costs: $8,800 (Lambda incident) + $120K/year (other anomalies caught early)
- ROI: 400% in first year
Use Case 6: Reserved Instance & Savings Plan Optimization
Challenge: Media streaming company spending $1.2M/month on AWS EC2, mostly on-demand pricing. CFO mandated 30% cost reduction.
Solution with AWS Lens:
-
Analysis:
- Steady-state compute: $800K/month (good candidates for RIs/SPs)
- Variable compute: $400K/month (keep on-demand/spot)
-
RI/SP Purchase Recommendations:
- 1-year Compute Savings Plans: $500K upfront → Save 20% ($80K/year)
- 3-year EC2 Instance Savings Plans: $2M upfront → Save 50% ($240K/year)
- Total savings: $320K/year
-
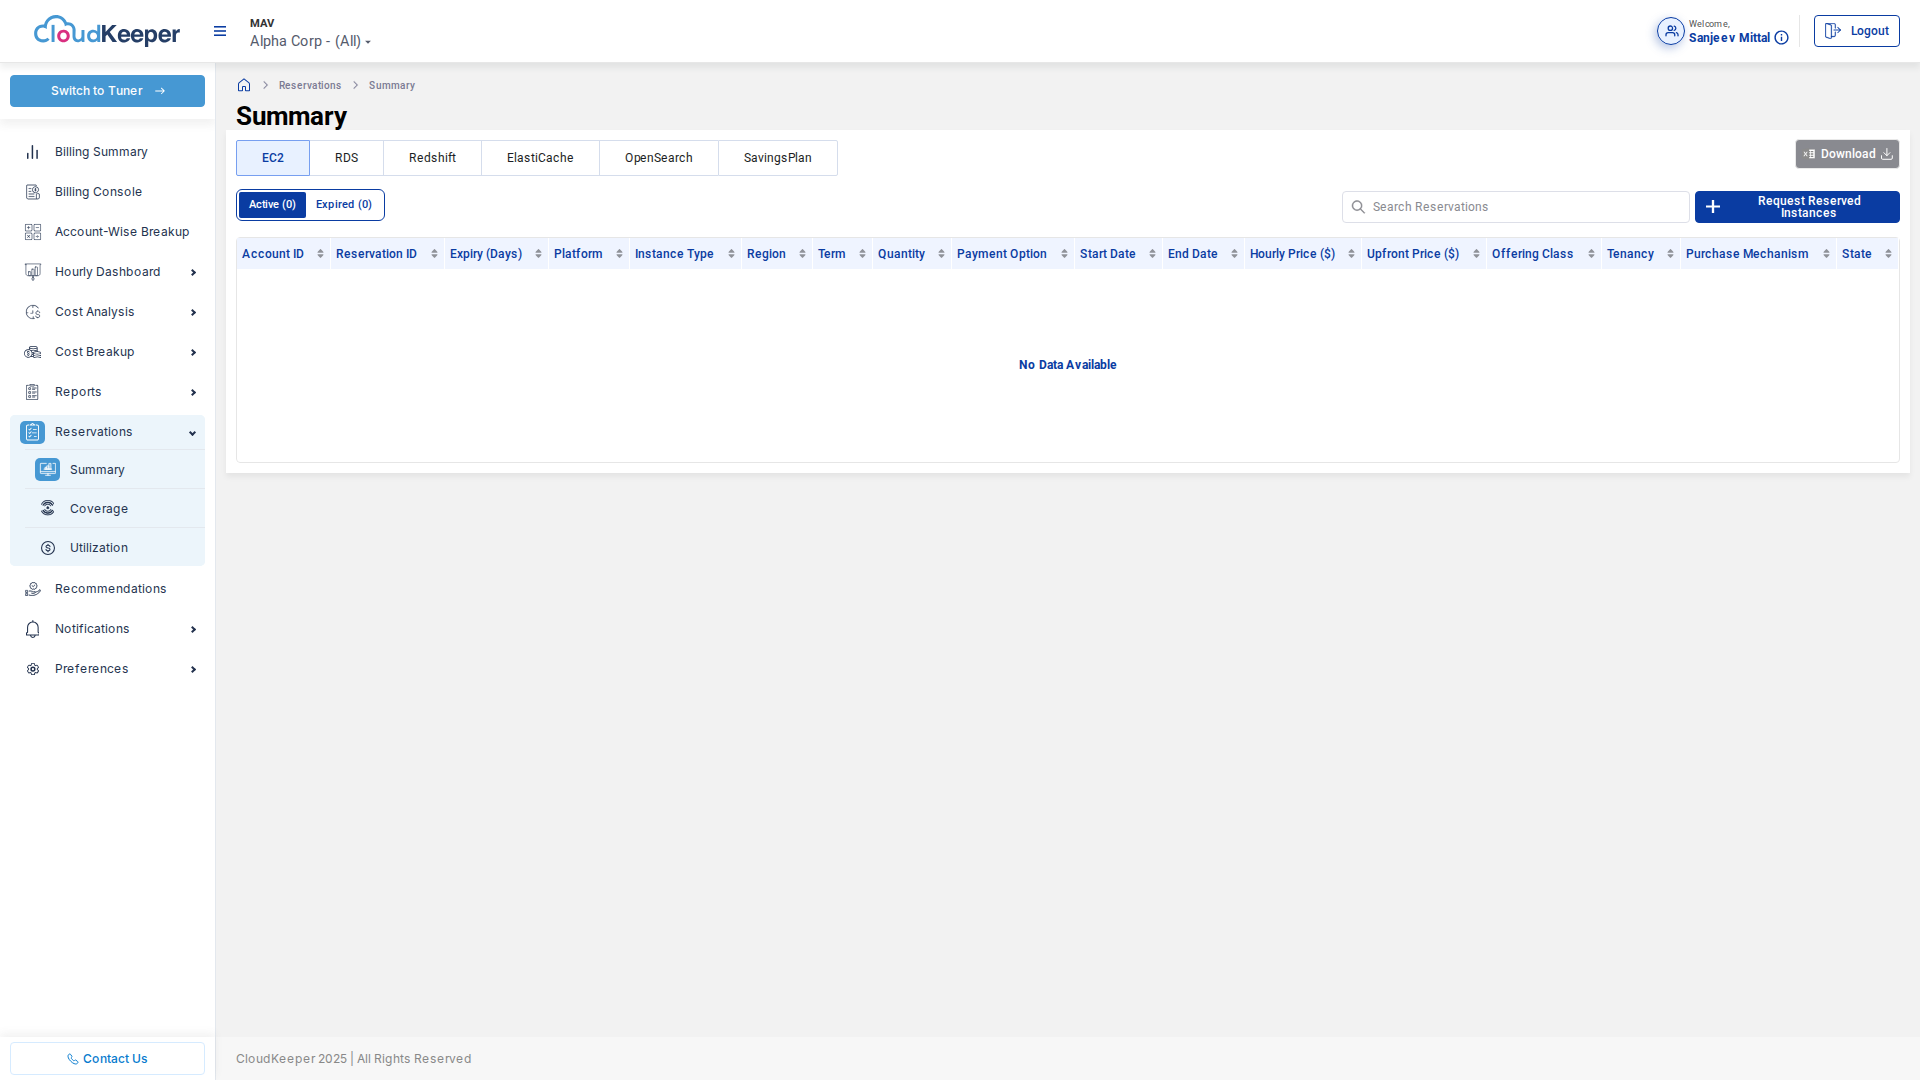
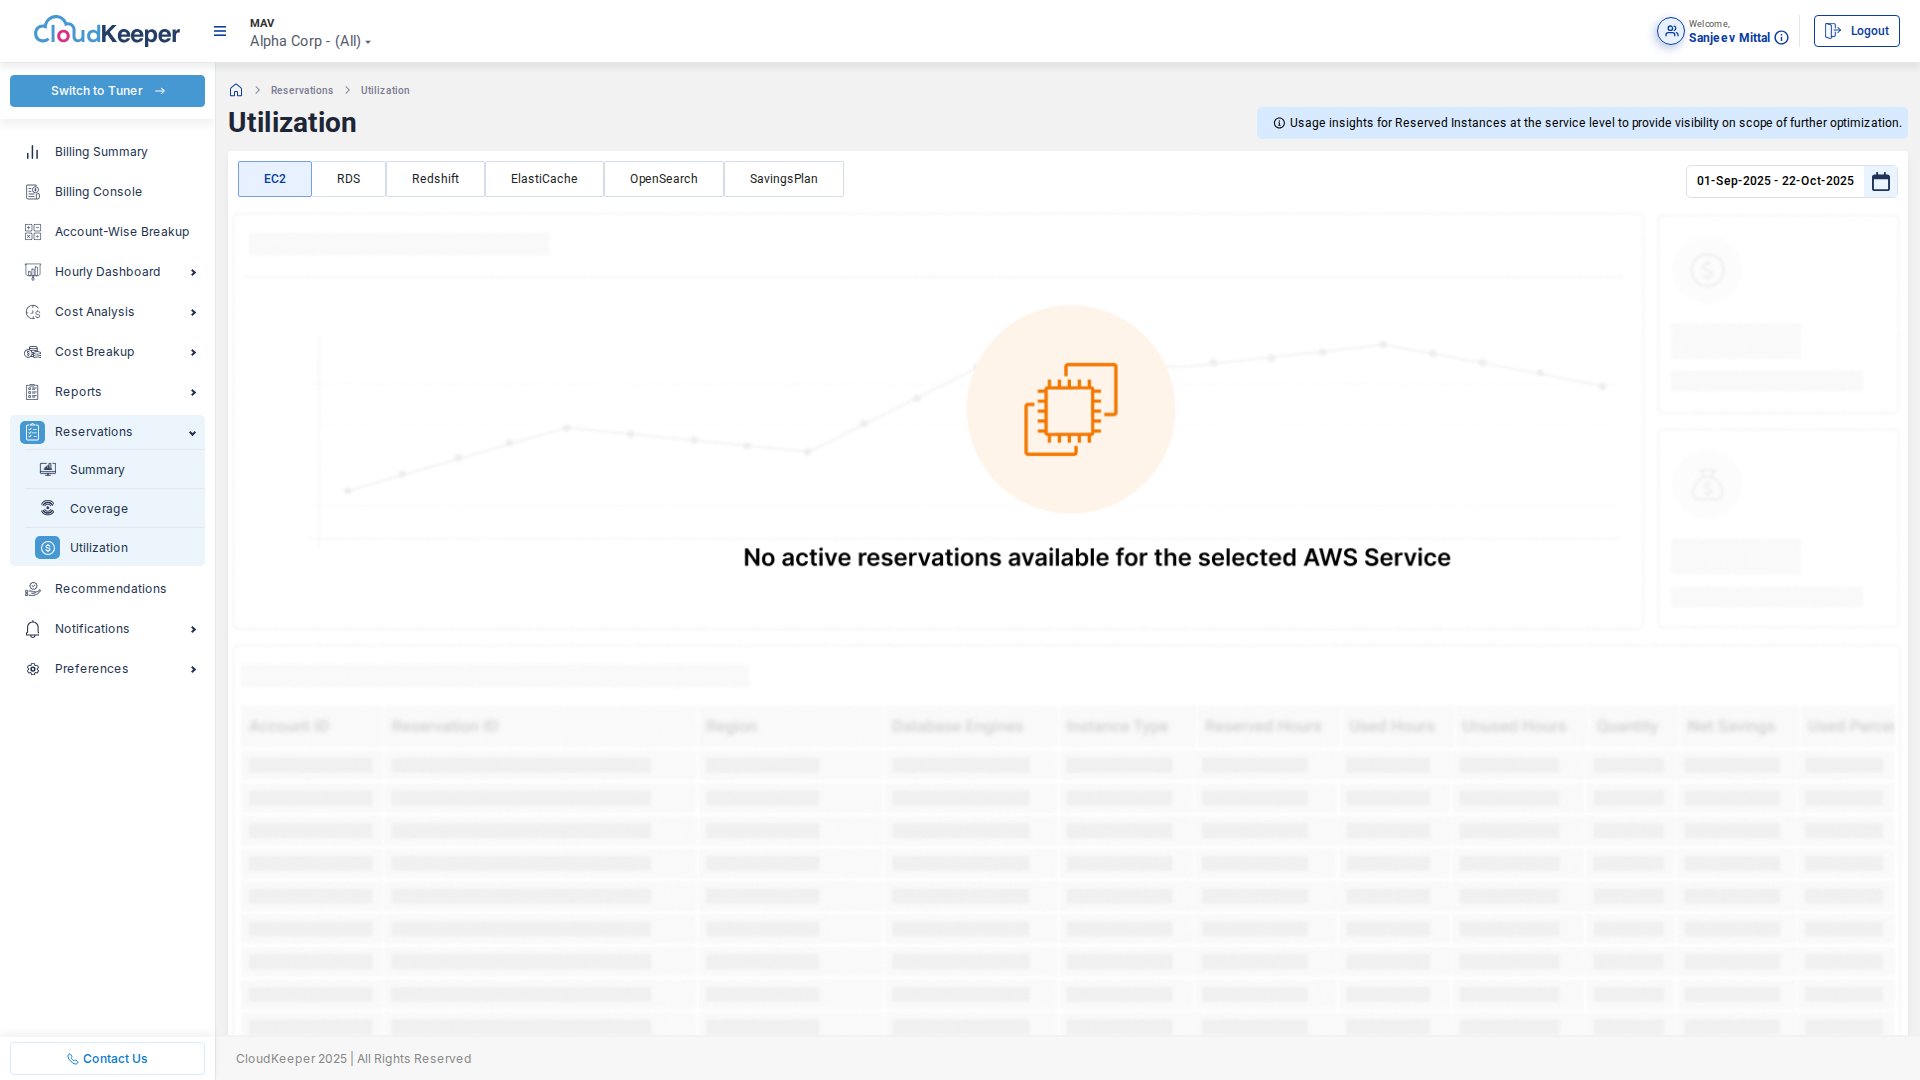
Utilization Monitoring:
- Track RI/SP usage daily
- Alert if utilization < 80% (means money being wasted)
- Modify or sell underutilized reservations on RI Marketplace
Results:
- Year 1: Purchased $2.5M in RIs/SPs, saved $320K (12.8% ROI on RI investment)
- Year 2: With monitoring, maintained 95%+ utilization
- Year 3: By renewal time, usage patterns had changed—AWS Lens identified new optimal mix, saved additional $50K
Cumulative Savings: $370K/year ongoing
ROI:
- Tool cost: $3,000/month = $36K/year
- Savings: $370K/year
- ROI: 930%
For Engineering & DevOps
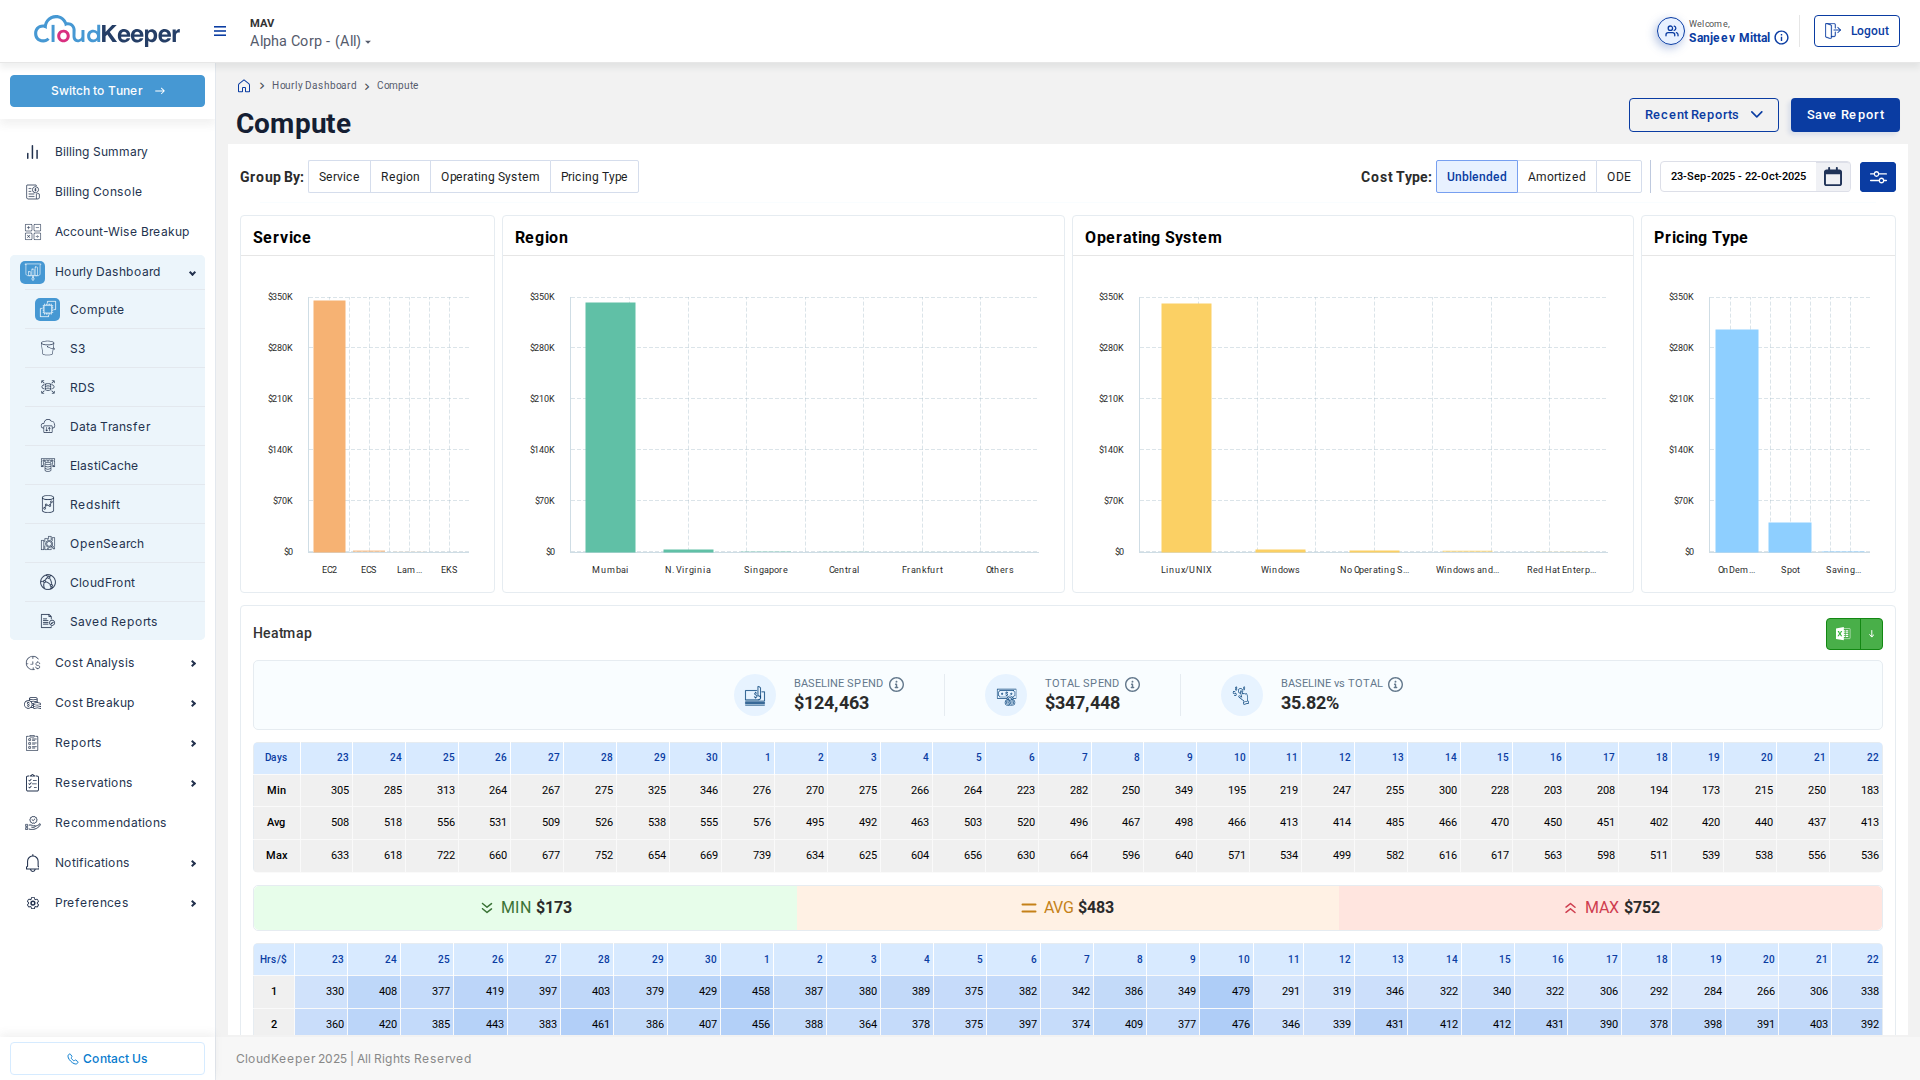
Use Case 7: Service Cost Attribution & Right-Sizing
Challenge: Engineering team at fintech startup was deploying new microservices rapidly but had no idea which services were expensive vs cheap. Over-provisioning was rampant.
Solution with AWS Lens:
-
Service-Level Cost Visibility:
Monthly Costs by Microservice:
- Payment Processing API: $45K (heavily used, justified)
- User Authentication: $32K (opportunity to optimize)
- Email Service: $18K (runs on m5.xlarge, could use t3.medium)
- Audit Logging: $12K (low priority, over-provisioned) -
Right-Sizing Recommendations:
- Email Service: CPU utilization 15% → Recommendation: Downsize to t3.medium
- Savings: $12K/month (67% reduction)
-
Developer Feedback Loop:
- Embedded cost widget in internal developer portal
- Each team sees their services' costs in daily standup
- Cost becomes a performance metric alongside latency, uptime
Results:
- Immediate savings: $45K/month from right-sizing over-provisioned services
- Cultural change: Engineers started asking "what instance type do we need?" before deploying
- Long-term: New services are sized correctly from day 1
ROI:
- Savings: $45K/month × 12 = $540K/year
- Tool cost: $2K/month = $24K/year
- ROI: 2,150%
Use Case 8: Development Environment Cost Management
Challenge: Software company with 50 engineers spending $80K/month on dev/staging environments that ran 24/7 even though only used 40 hours/week.
Solution with AWS Lens:
-
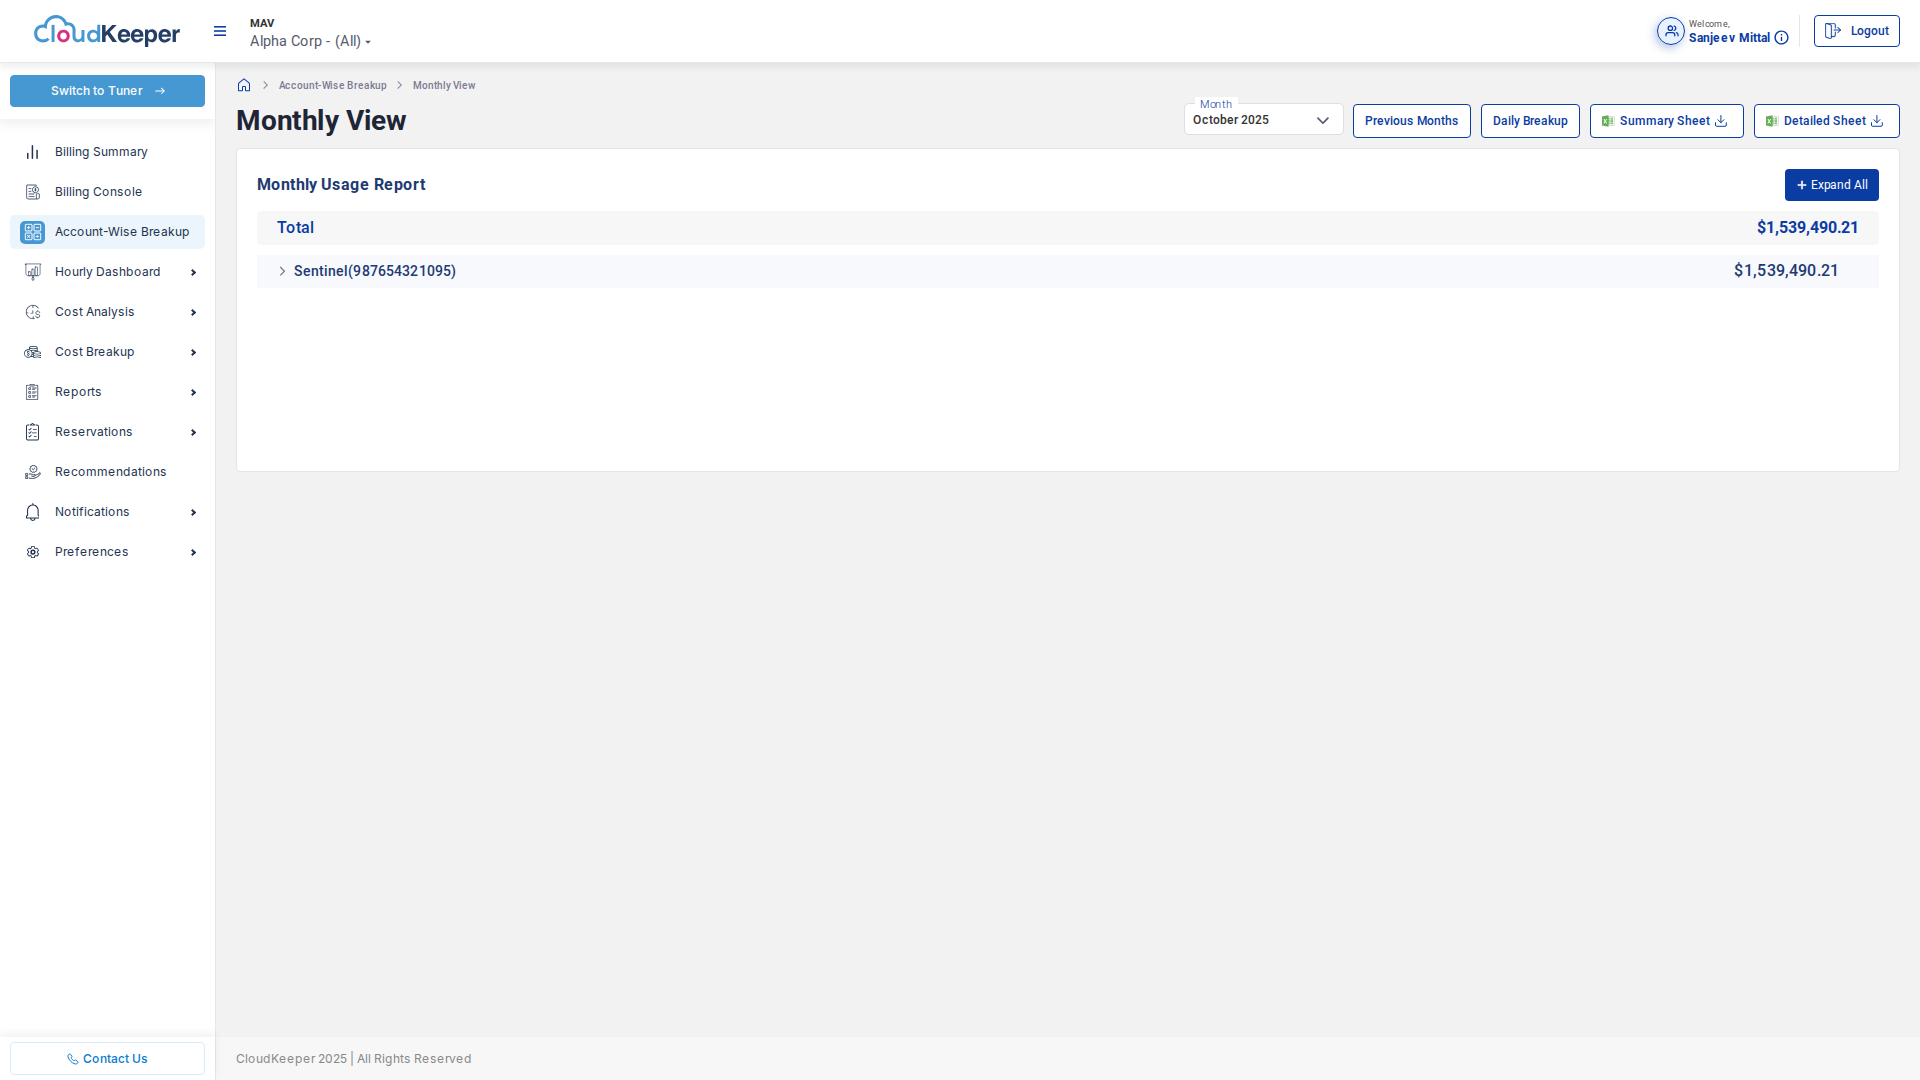
Environment Visibility:
Tag-based cost breakdown:
- Environment=Production: $120K/month (justified)
- Environment=Staging: $45K/month (used only business hours)
- Environment=Development: $35K/month (used only business hours) -
Optimization Strategy:
- Schedule dev/staging shutdown: Evenings (6pm-9am) + weekends
- Uptime reduction: 168 hours/week → 50 hours/week (70% reduction)
- Potential savings: $80K × 70% = $56K/month
-
Implementation:
- AWS Instance Scheduler: Automated start/stop
- Keep production 24/7
- Exception process for engineers working off-hours
Results:
- Actual savings: $52K/month (65% reduction, slightly less than projected due to some exceptions)
- No productivity impact: Engineers don't work evenings/weekends anyway
- Additional benefit: Faster weekly deployments (fresh environment each Monday)
ROI:
- Savings: $52K/month × 12 = $624K/year
- Implementation cost: $10K one-time + $500/month tool
- ROI: 6,100% in first year
Use Case 9: CI/CD Pipeline Cost Optimization
Challenge: DevOps team running 500+ CI/CD builds/day on AWS was spending $25K/month, but didn't know which pipelines or which projects were expensive.
Solution with AWS Lens:
-
Tag Strategy:
- Tag CI/CD resources with: Project, Team, Pipeline Type (build/test/deploy)
- Example: Project=MobileApp, Team=iOS, Type=IntegrationTest
-
Cost Analysis:
Monthly CI/CD Costs by Project:
- Mobile App: $12K (justified, 200 builds/day)
- Web Platform: $6K (justified)
- Internal Tools: $4K (only 20 builds/day, very expensive per build)
- Legacy Project: $3K (project being sunset, waste) -
Optimizations:
- Internal Tools: Move from c5.2xlarge to t3.xlarge (50% cost reduction)
- Legacy Project: Reduce build frequency (only on-demand, not automatic)
- Use Spot Instances for non-critical builds (70% cost reduction)
Results:
- Immediate savings: $8K/month
- Build performance: Maintained (spot instances sufficient for CI/CD)
- Developer satisfaction: Faster feedback (expensive builds now only for critical paths)
ROI:
- Savings: $8K/month × 12 = $96K/year
- Implementation effort: 1 week (DevOps engineer)
- ROI: 480%
For Enterprise Architects
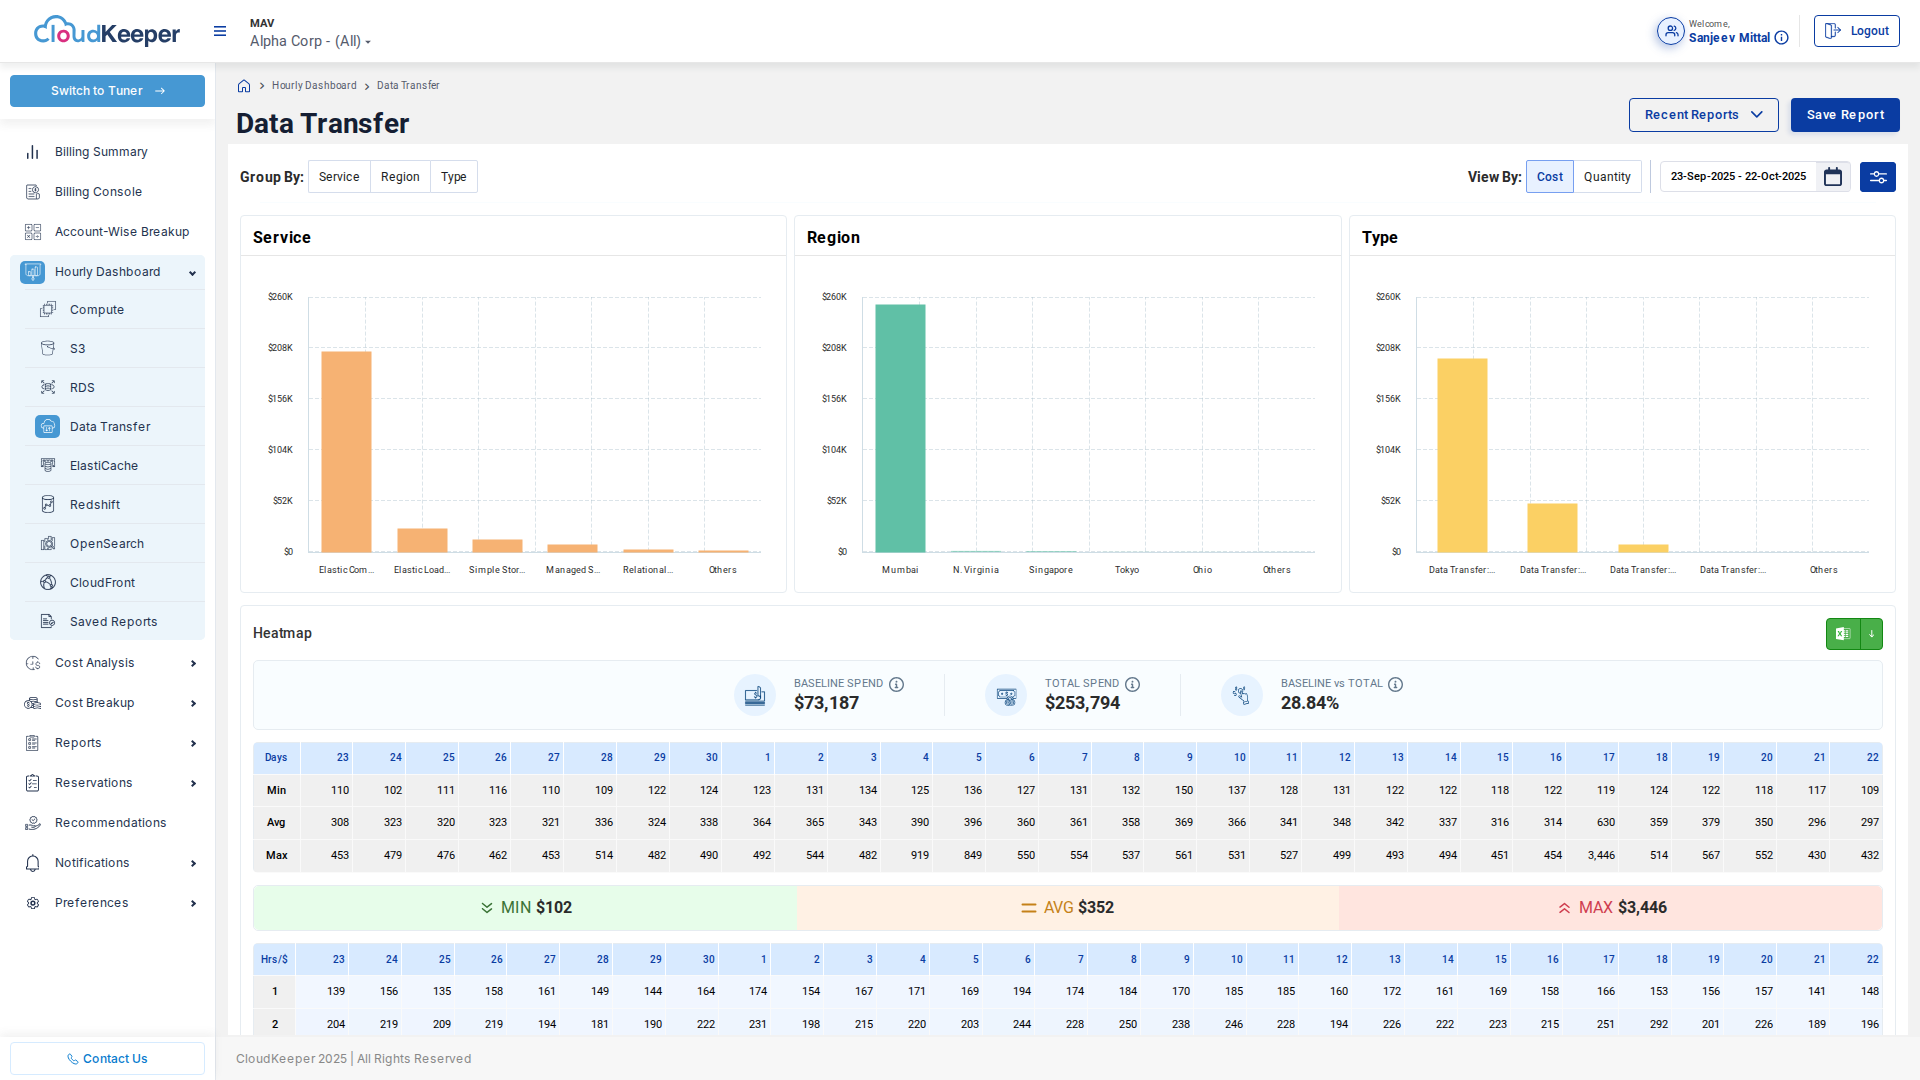
Use Case 10: Multi-Region Architecture Cost Modeling
Challenge: Global SaaS company considering expanding from single region (us-east-1) to multi-region for better latency and disaster recovery. Needed to model costs before implementation.
Solution with AWS Lens:
-
Current State Analysis:
- Total monthly cost: $400K
- Single region: us-east-1
- Data transfer: $15K/month (mostly CloudFront egress)
-
Multi-Region Cost Modeling:
Projected Additional Costs:
- eu-west-1 region: +$120K (30% of us-east-1 for EU customers)
- Cross-region replication: +$8K (RDS multi-region)
- Data transfer (inter-region): +$12K (application sync)
- Total new cost: $540K/month (+35%) -
Decision Framework:
- Benefit: 80ms → 20ms latency for EU customers (better UX)
- Cost: +$140K/month = $1.68M/year
- Revenue impact: Estimated 5% conversion improvement = $3M/year
- ROI: Positive, proceed with multi-region
Results:
- Informed decision: Proceeded with multi-region, actual costs within 5% of projection
- Revenue impact: 7% conversion improvement (better than projected)
- Follow-up optimization: After 6 months, used AWS Lens to further optimize eu-west-1 costs by $20K/month
Value:
- Avoided expensive mistake (accurate cost modeling)
- Enabled revenue-generating architecture decision
- Ongoing cost optimization ensures ROI
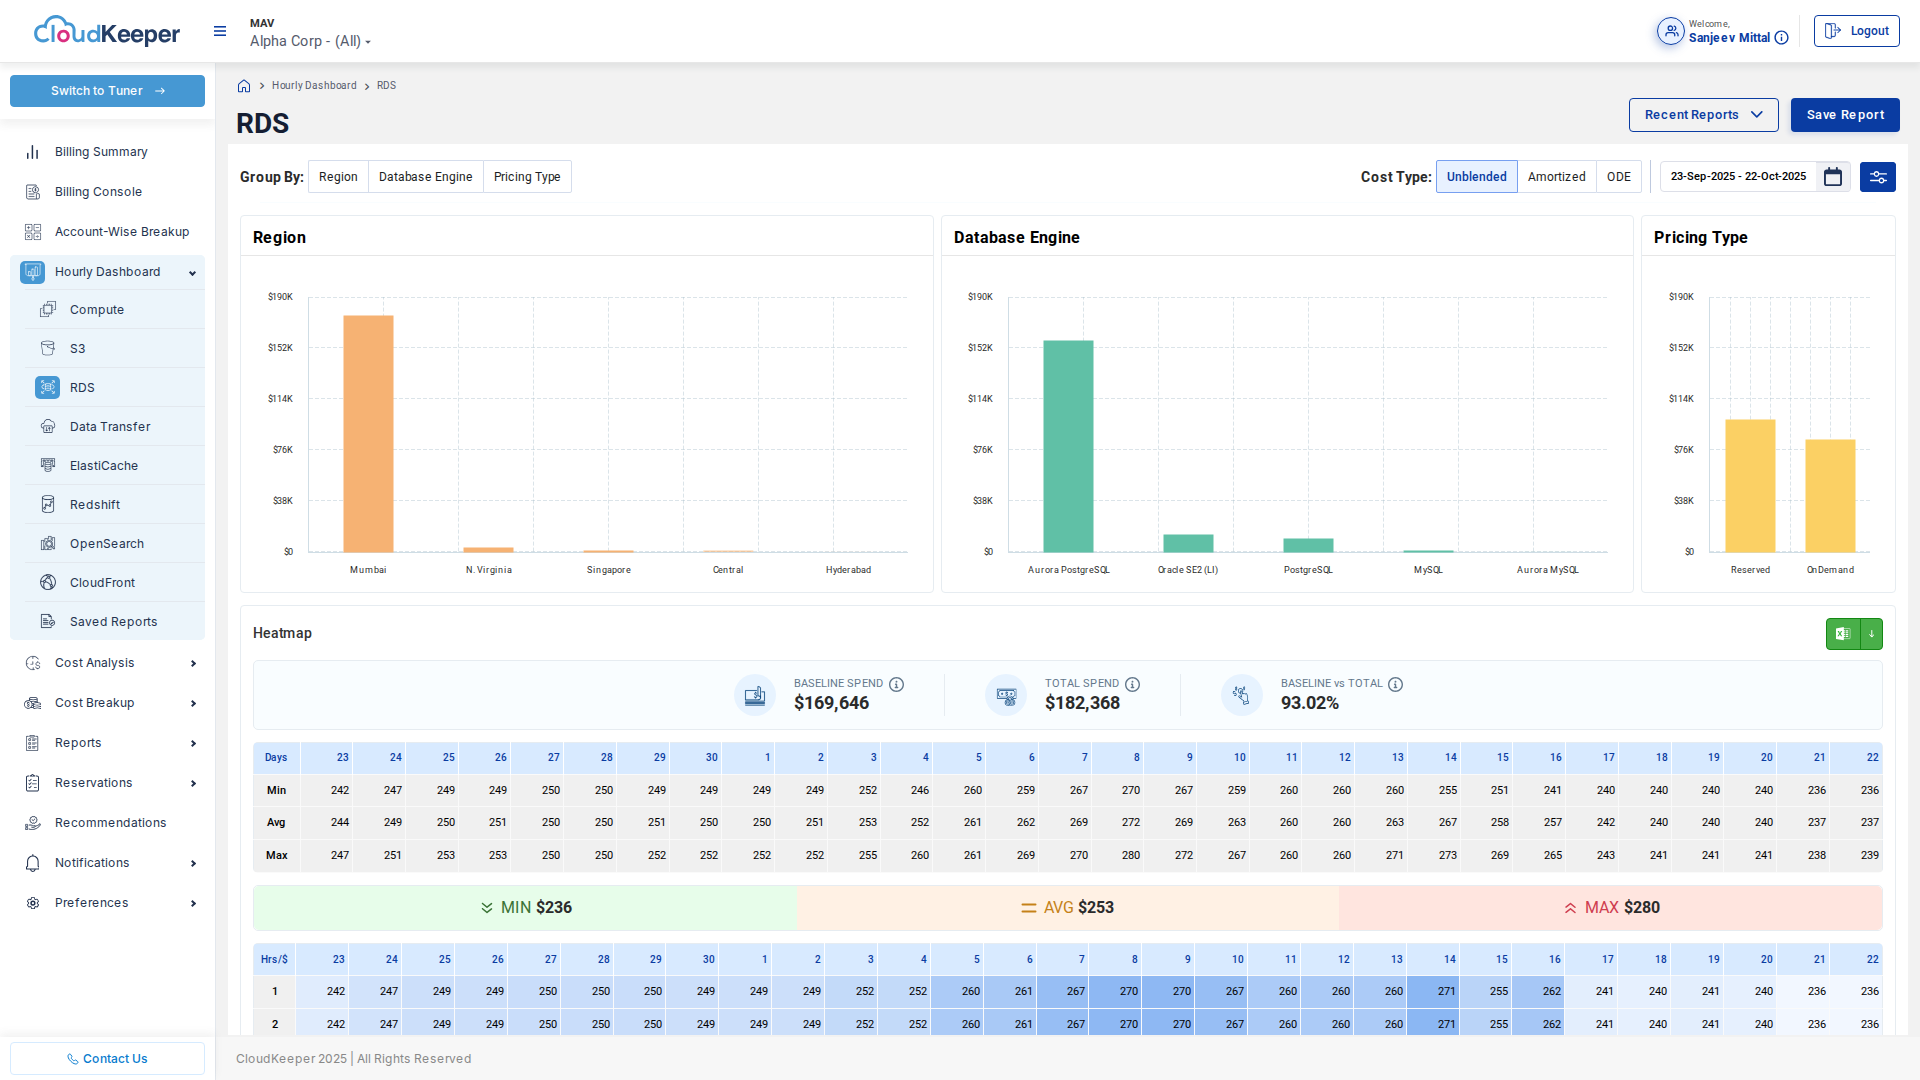
Use Case 11: Database Technology Selection
Challenge: Enterprise evaluating MongoDB Atlas on AWS vs self-managed MongoDB on EC2 vs Amazon DocumentDB vs Amazon DynamoDB for new application.
Solution with AWS Lens:
-
Current Database Costs (from similar applications):
RDS MySQL (similar workload):
- db.r5.2xlarge (3 instances Multi-AZ): $18K/month
- Storage (2TB): $2K/month
- Backups: $500/month
- Total: $20.5K/month -
Cost Projections (for new workload):
Option A: MongoDB Atlas (managed):     $28K/month
Option B: EC2 + self-managed MongoDB:  $15K/month (but +ops burden)
Option C: Amazon DocumentDB:           $22K/month
Option D: DynamoDB: $12K/month (at projected scale) -
Total Cost of Ownership:
Including operational costs (DBA time):
Option A: $28K infra + $0 ops = $28K
Option B: $15K infra + $8K ops = $23K
Option C: $22K infra + $0 ops = $22K
Option D: $12K infra + $0 ops = $12K (winner)
Results:
- Selected DynamoDB: Lowest TCO, fully managed, scales automatically
- Actual costs: $11K/month (within projection)
- Savings vs MongoDB Atlas: $17K/month = $204K/year
ROI:
- AWS Lens enabled data-driven architecture decision
- Avoided $204K/year in excess database costs
- Value: Immeasurable (wrong decision would impact product for years)
Industry-Specific Use Cases
Healthcare: HIPAA Compliance & Cost Optimization
Challenge: Healthcare provider needed HIPAA-compliant cloud infrastructure but couldn't afford enterprise AWS support contract.
Solution:
- AWS Lens provided detailed audit trails for cost allocation (required for compliance)
- Encryption-at-rest verification for all S3/EBS resources
- Identified $45K/month in non-compliant dev/test data that could be deleted
Results: HIPAA compliance + $540K/year savings
E-commerce: Seasonal Scaling Cost Management
Challenge: Online retailer with 10x traffic spike during holiday season (Black Friday, Christmas) needed to scale infrastructure but control costs.
Solution:
- AWS Lens tracked hourly costs during scale-up
- Identified that scale-down after holidays was incomplete (30% of resources still running)
- Created alert for "unusual spend in January" (post-holiday)
Results: Avoided $180K in wasted spend from incomplete scale-down
Financial Services: Regulatory Reporting
Challenge: Bank needed to report cloud costs broken down by regulatory entity (different business lines have different regulators).
Solution:
- Tagged resources by RegulatoryEntity (OCC, SEC, FDIC, etc.)
- AWS Lens generated automated monthly reports for each regulator
- Compliance team saved 40 hours/month on manual reporting
Results: Compliance + time savings worth $80K/year
Media & Entertainment: Content Delivery Cost Optimization
Challenge: Streaming media company spending $800K/month on CloudFront + S3 for video delivery.
Solution:
- AWS Lens identified that 40% of content was accessed less than 1 time/month
- Moved cold content to S3 Glacier ($120K/month savings)
- Optimized CloudFront settings based on actual usage patterns ($80K/month savings)
Results: $200K/month savings = $2.4M/year (25% cost reduction)
ROI Calculator & Business Case
Simple ROI Framework
Total Annual Benefit = Cost Savings + Time Savings + Avoided Costs

Cost Savings:
- Recommendation implementation: $X/month × 12
- Right-sizing: $Y/month × 12
- Reservation optimization: $Z/month × 12

Time Savings:
- Finance team: Hours saved × Hourly rate × 12 months
- FinOps team: Hours saved × Hourly rate × 12 months
- Engineering team: Hours saved × Hourly rate × 12 months

Avoided Costs:
- Budget overruns prevented: $XX
- Anomaly detection (runaway resources): $YY
- Compliance violations avoided: $ZZ

Total Annual Cost:
- AWS Lens subscription: $AA
- Implementation effort: $BB (one-time)
- Ongoing management: $CC

ROI = (Total Annual Benefit - Total Annual Cost) / Total Annual Cost × 100%
Example Calculation
Company: Mid-size SaaS, $600K/month AWS spend
Total Annual Benefit:
- Cost savings (15% reduction): $600K × 0.15 × 12 = $1,080K
- Time savings (finance + FinOps): $50K
- Avoided costs (budget overruns): $100K
Total: $1,230K

Total Annual Cost:
- AWS Lens: $36K
- Implementation: $10K (one-time)
- Management: $12K (1 hour/week × $50/hour)
Total: $58K

ROI = ($1,230K - $58K) / $58K × 100% = 2,020%
Payback Period: 0.6 months (less than 3 weeks!)
Industry Benchmarks
Typical Cost Reduction by AWS spend level:
| Annual AWS Spend | Typical Reduction | Annual Savings |
|---|---|---|
| $1M - $5M | 15-25% | $150K - $1.25M |
| $5M - $20M | 12-20% | $600K - $4M |
| $20M - $100M | 10-15% | $2M - $15M |
| $100M+ | 8-12% | $8M+ |
Time Savings:
- Finance teams: 20-40 hours/month → 2-5 hours/month
- FinOps teams: 80-120 hours/month → 20-30 hours/month
- Engineering teams: Ad-hoc time → systematic process
Building Your Business Case
Executive Summary Template
AWS Lens Business Case for [Company Name]

Current State:
- Annual AWS spend: $X million
- Cost visibility: Limited (manual monthly review)
- Optimization: Ad-hoc (no systematic process)
- Forecast accuracy: ±25%

Proposed Solution: AWS Lens Implementation

Expected Benefits (Year 1):
- Cost reduction: $XX (15% of current spend)
- Time savings: $YY (finance + FinOps teams)
- Avoided overruns: $ZZ
Total benefit: $[X+Y+Z]

Investment Required:
- AWS Lens subscription: $36K
- Implementation: $10K (one-time)
Total cost: $46K

Year 1 ROI: [Calculate]%
Payback period: [Calculate] months

Recommendation: Approve AWS Lens implementation
Stakeholder-Specific Benefits
For CFO:
- Real-time visibility into cloud spending (no more surprises)
- Accurate forecasting for budgeting
- Quantified optimization opportunities
- Board-ready reporting
For CTO:
- Engineering teams empowered with cost data
- Data-driven architecture decisions
- Optimization without sacrificing performance
- Competitive advantage (lower unit costs)
For VP of Engineering:
- Service-level cost visibility
- Right-sizing recommendations
- Development environment cost control
- CI/CD cost optimization
Getting Started
Quick Win Approach (30 Days)
Week 1: Setup
- Connect AWS accounts to AWS Lens
- Configure basic tags
- Establish baseline current spend
Week 2: Low-Hanging Fruit
- Implement storage optimization ($20K-50K/month typical savings)
- Delete old snapshots and unused resources ($5K-15K/month)
- Schedule dev/test environment shutdowns ($10K-30K/month)
Week 3: Right-Sizing
- Implement top 5 right-sizing recommendations
- Typical savings: $15K-40K/month
Week 4: Reporting & Governance
- Set up automated reports for stakeholders
- Configure budget alerts
- Establish ongoing optimization process
30-Day Savings Target: $50K-135K/month → $600K-1.62M/year
Long-Term Strategy (90 Days)
Days 1-30: Quick wins (above)
Days 31-60: Optimization
- Reservation/Savings Plan analysis and purchases
- Multi-account cost allocation (chargeback)
- Custom dashboard for each stakeholder group
Days 61-90: Governance & Culture
- Tagging policy enforcement
- Cost awareness in engineering (embed in developer portal)
- Monthly cost optimization reviews
90-Day Target: 15-20% cost reduction, systematic cost management culture
Next Steps
Resources
- Executive Overview - High-level AWS Lens introduction
- Key Features - Detailed feature walkthrough
- Solution Architecture - Technical architecture
- Deployment Guide - Implementation instructions
Contact
- Schedule Demo: See AWS Lens in action with your actual AWS data
- Free Trial: 30-day trial with no commitment
- Proof of Concept: 90-day evaluation with guaranteed savings target
Email: support@cloudkeeper.com Website: https://www.cloudkeeper.com/aws-lens
These use cases are based on real customer experiences. Individual results will vary based on AWS usage patterns, organization maturity, and implementation approach.