Key Features & Capabilities
This document provides a comprehensive walkthrough of AWS Lens features, demonstrating how each capability addresses specific cloud cost management challenges.
Table of Contents
- Cost Visibility & Dashboards
- Service-Specific Analysis
- Cost Explorer & Analytics
- Reservation Intelligence
- Cost Optimization Engine
- Multi-Account Management
- Reporting & Alerts
- Administration & Governance
Cost Visibility & Dashboards
Billing Summary Dashboard
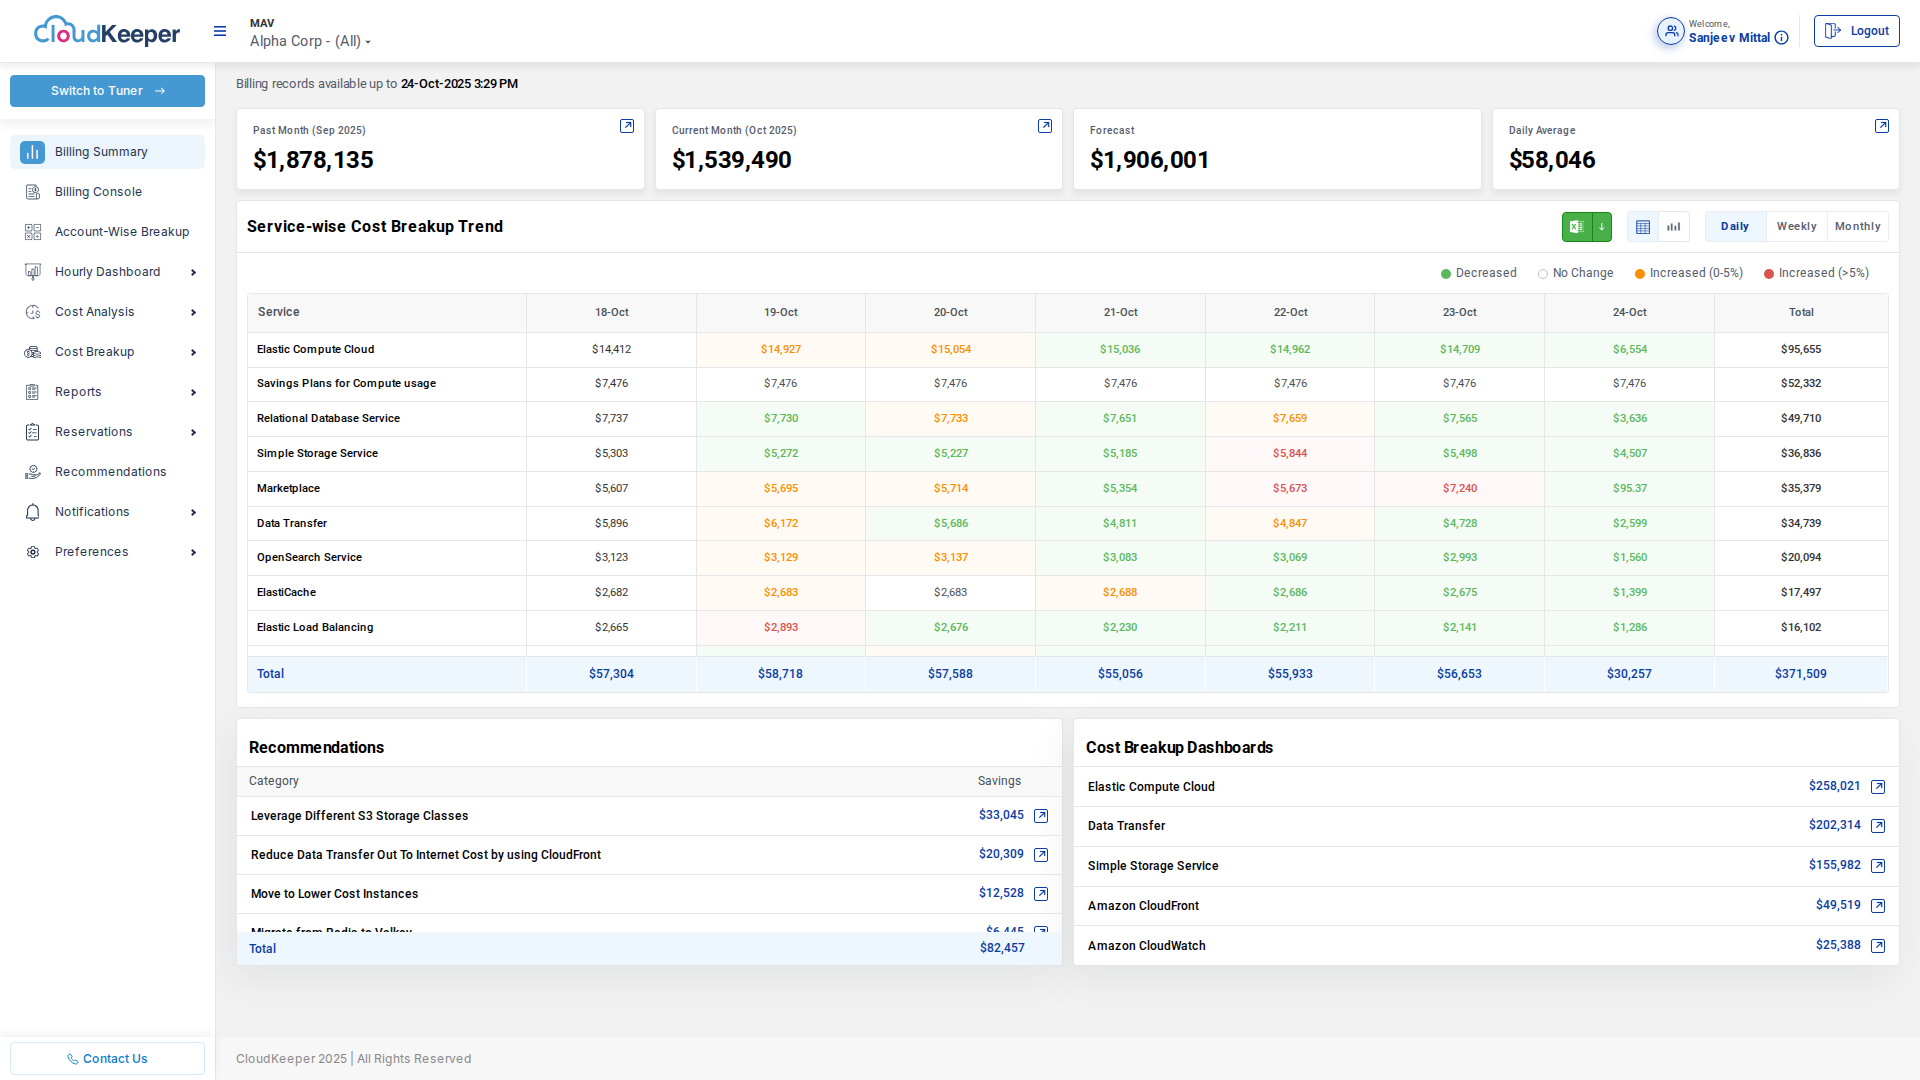
Purpose: Provides at-a-glance visibility into current AWS spending with key metrics and trends.
Key Features:
Financial Metrics Cards
- Past Month Spend: Historical spending for comparison
- Current Month Spend: Real-time accumulated costs
- Forecast: Projected month-end spending based on current trends
- Daily Average: Average daily spend for budgeting
Example Metrics (from demo):
Past Month (Sep 2025):  $1,878,135
Current Month (Oct 2025): $1,539,490
Forecast:                $1,906,001
Daily Average:           $58,046
Service-Wise Cost Breakup Trend
Interactive table showing daily costs by AWS service:
| Service | 18-Oct | 19-Oct | 20-Oct | 21-Oct | 22-Oct | 23-Oct | 24-Oct | Total |
|---|---|---|---|---|---|---|---|---|
| Elastic Compute Cloud | $14,412 | $14,927 | $15,054 | $15,036 | $14,962 | $14,709 | $6,554 | $95,655 |
| Savings Plans for Compute | $7,476 | $7,476 | $7,476 | $7,476 | $7,476 | $7,476 | $7,476 | $52,332 |
| Relational Database Service | $7,737 | $7,730 | $7,733 | $7,661 | $7,659 | $7,565 | $3,636 | $49,710 |
Value: Immediately identify which services are driving costs and spot unusual spending patterns (highlighted in red/green).
Quick Recommendations Panel
Displays top cost-saving opportunities directly on the dashboard:
Recommendations:
- Leverage Different S3 Storage Classes     $33,045 savings
- Reduce Data Transfer with CloudFront     $20,309 savings
- Move to Lower Cost Instances             $12,528 savings
Cost Breakup Dashboards
Quick access to detailed cost analysis by service:
- Elastic Compute Cloud: $258,021
- Data Transfer: $202,314
- Simple Storage Service: $155,982
- Amazon CloudFront: $49,519
- Amazon CloudWatch: $25,388
Billing Console
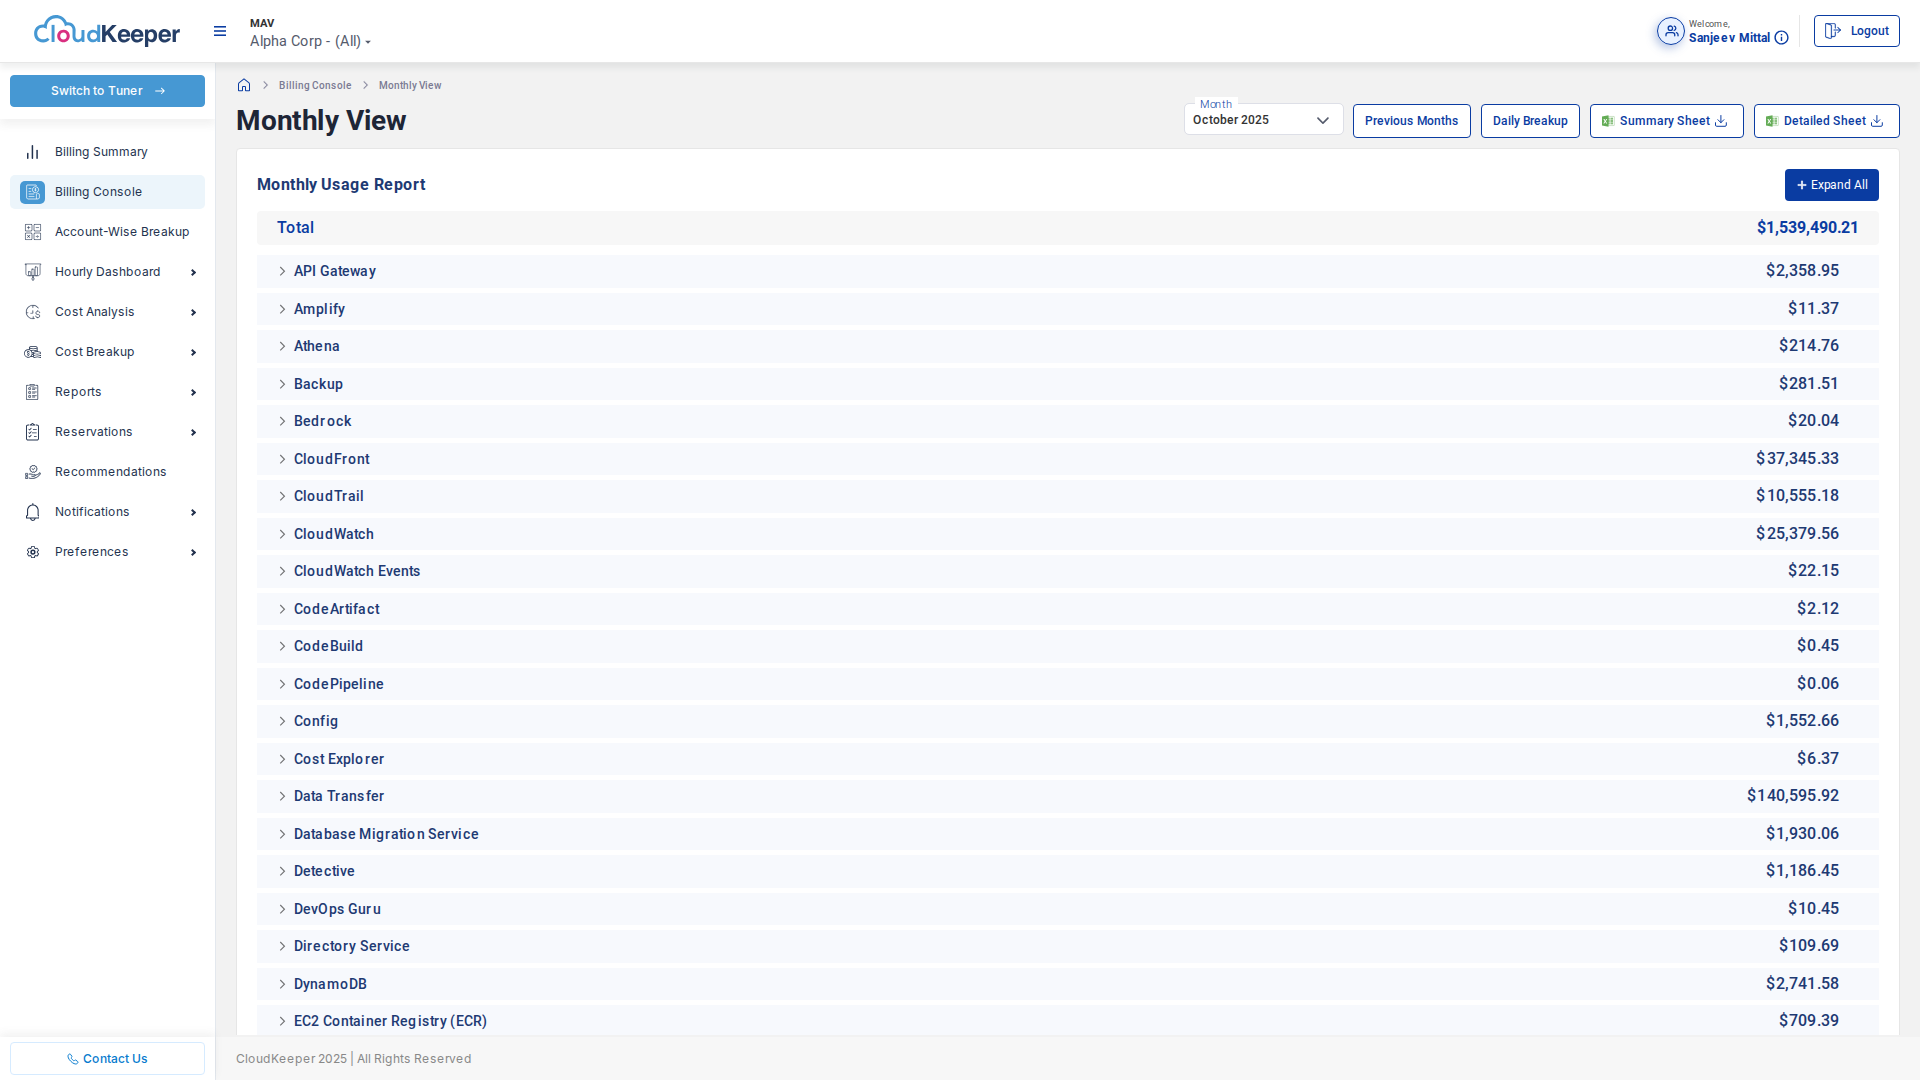
Purpose: Detailed billing records interface for granular analysis and exports.
Key Features:
- Monthly/Weekly/Daily Views: Switch between aggregation levels
- Filter Capabilities: Filter by service, account, region, tags
- CSV Export: Download billing data for external analysis
- Invoice Access: Direct access to AWS invoices
- Cost Allocation Tags: View costs grouped by custom tags
Use Cases:
- Finance teams reconciling AWS invoices
- FinOps teams performing chargeback/showback
- Auditors reviewing cloud spending
Account-Wise Breakup
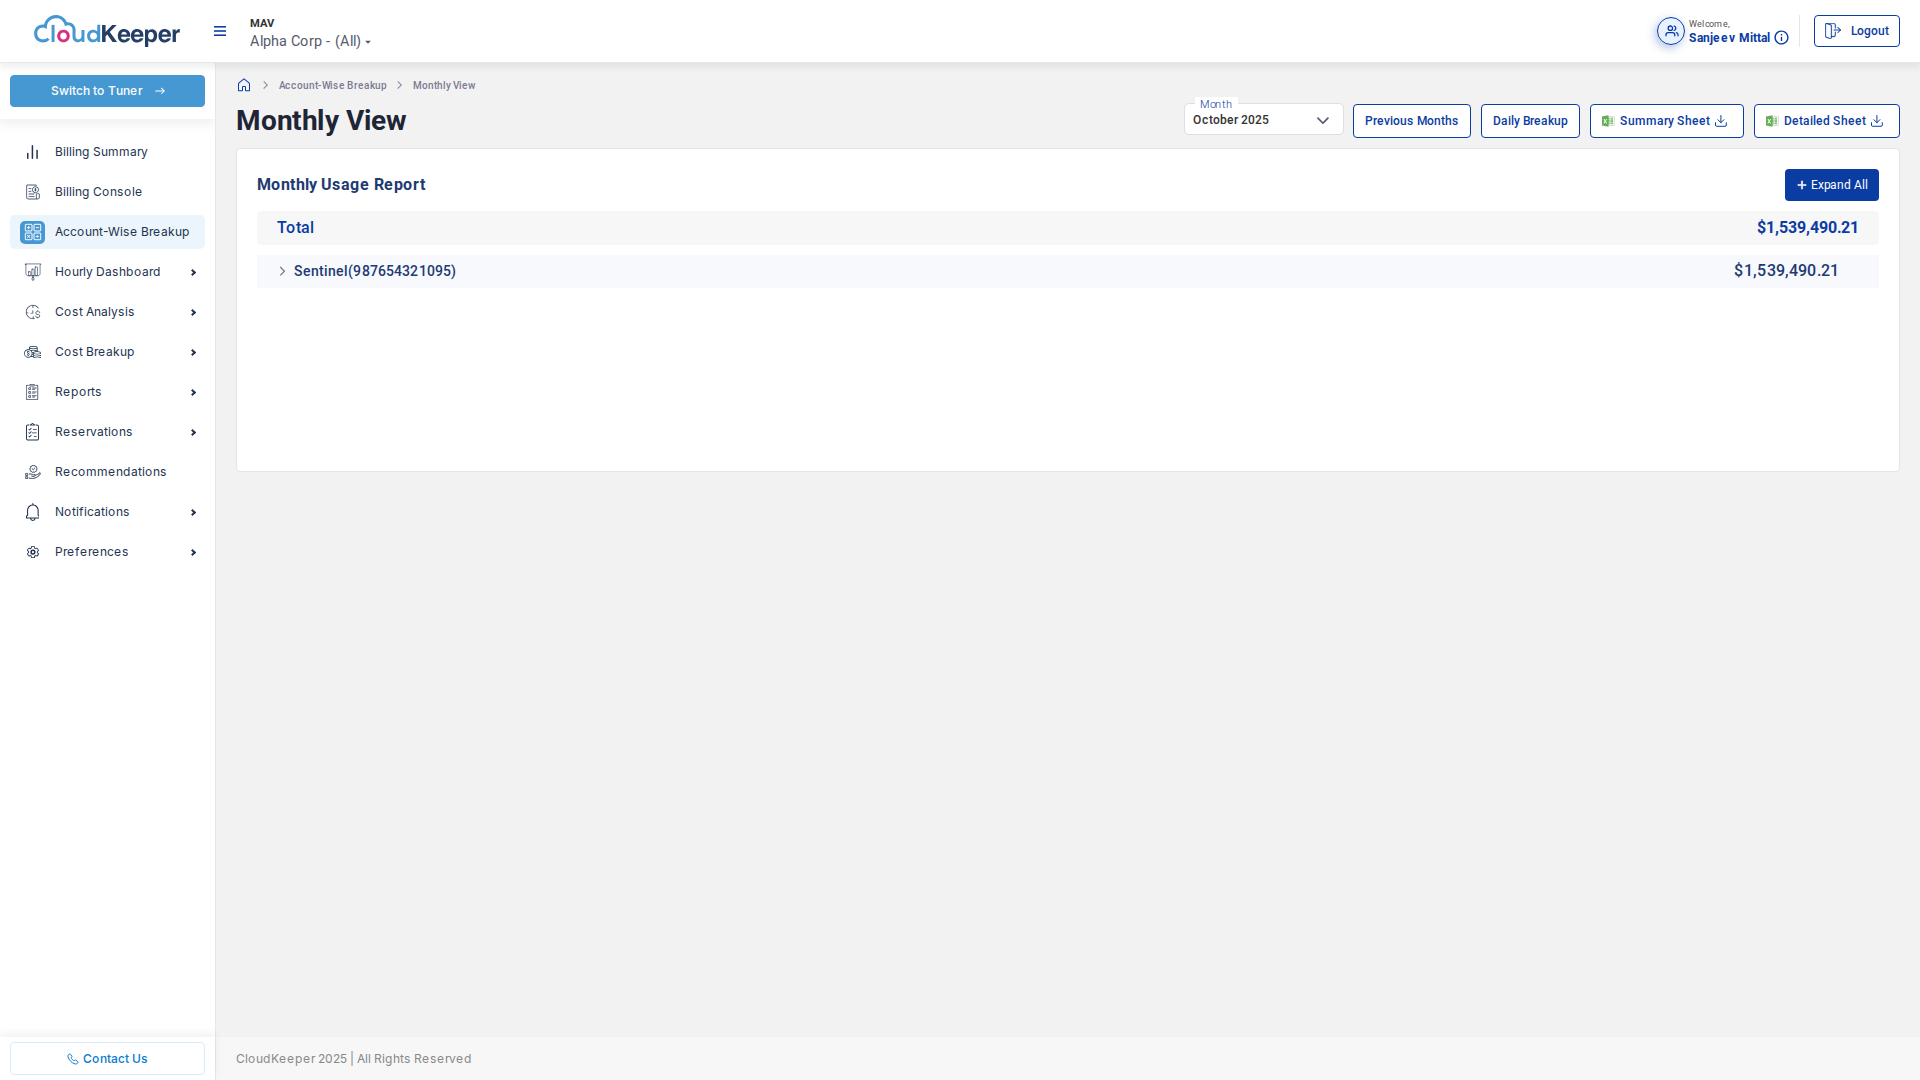
Purpose: Cost visibility across multiple AWS accounts in an Organization.
Key Features:
- Account Hierarchy: Visualize cost distribution across accounts
- Drill-Down: Click any account to see service-level breakdown
- Trend Analysis: Compare account spending over time
- Cost Allocation: Assign accounts to business units or cost centers
Value: Essential for enterprises with multi-account AWS Organizations (50+ accounts typical).
Service-Specific Analysis
AWS Lens provides dedicated dashboards for major AWS services, each optimized for that service's unique cost drivers.
Compute Dashboard
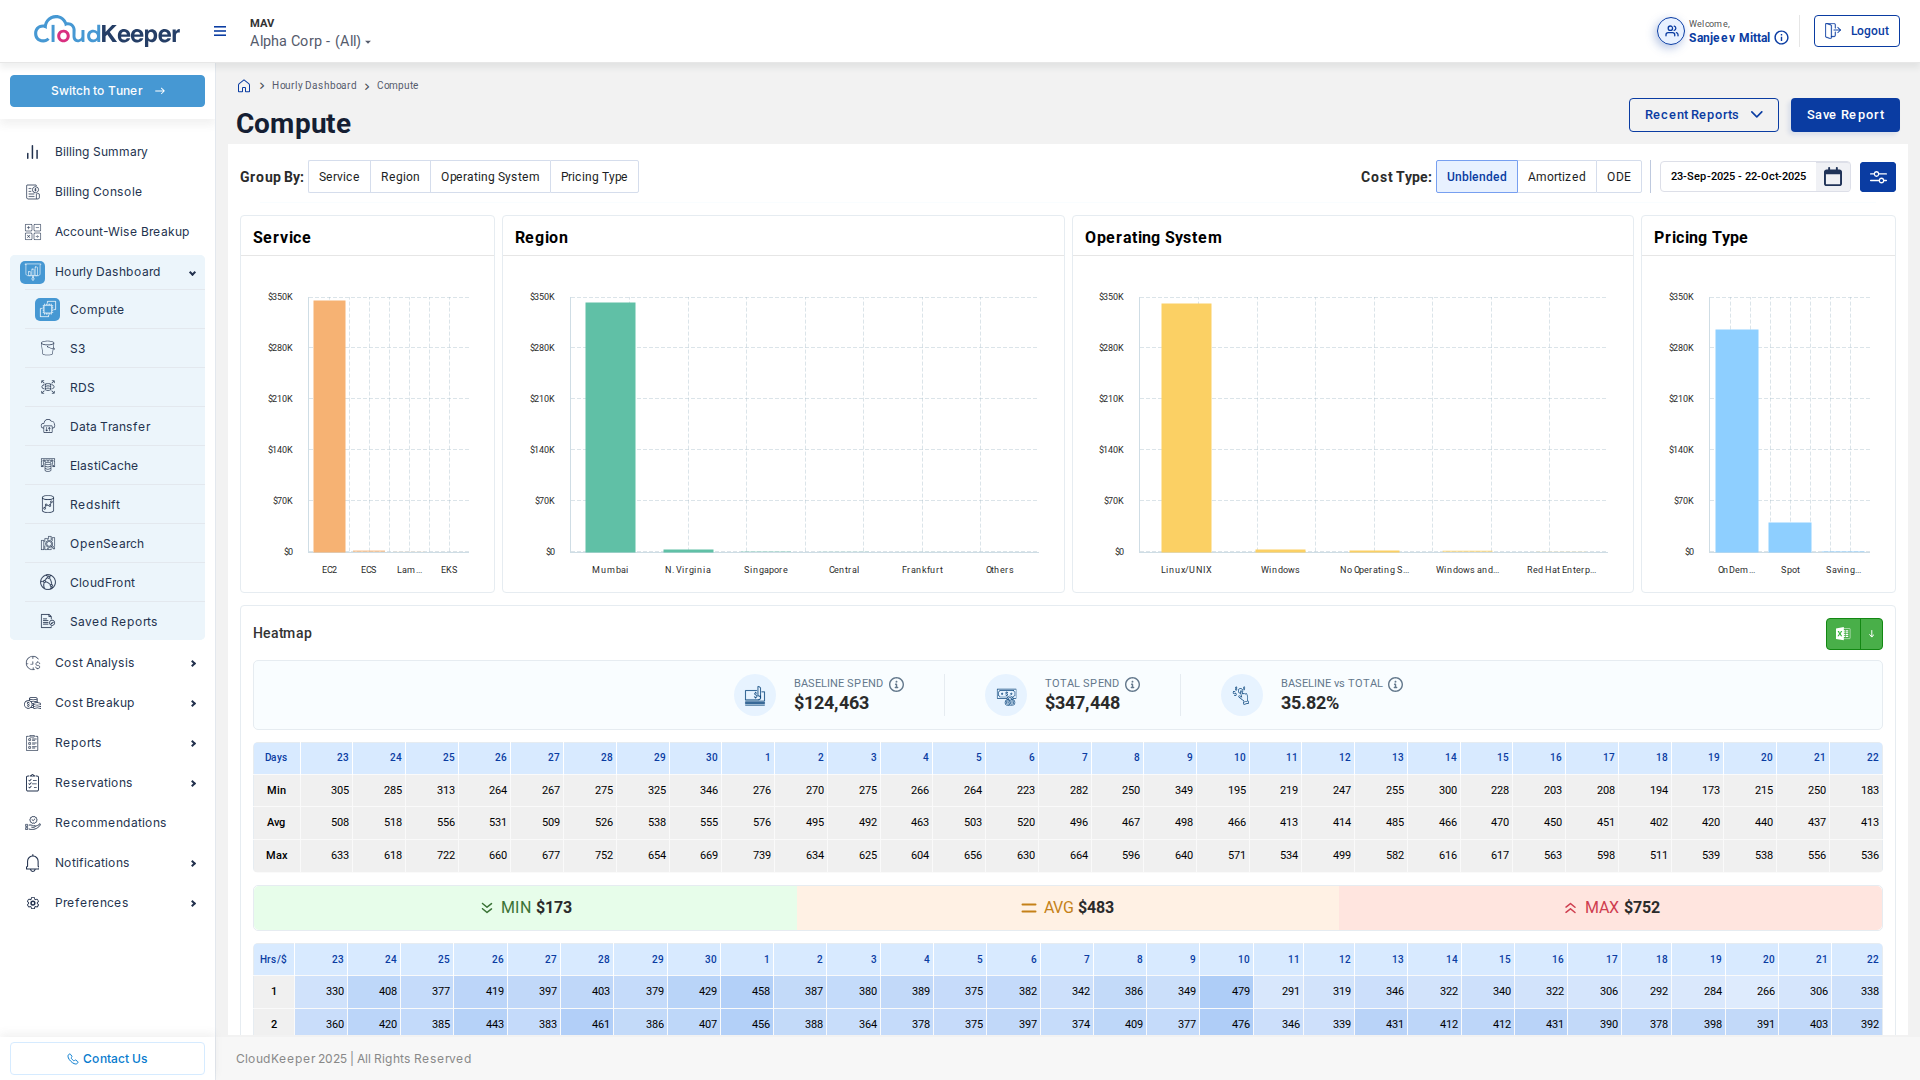
Purpose: Analyze EC2, ECS, EKS, Lambda, and other compute service costs.
Analysis Dimensions:
Group By Options
- Service: EC2, ECS, Lambda, Fargate, Batch
- Region: us-east-1, eu-west-1, ap-southeast-1, etc.
- Operating System: Linux, Windows, RHEL, SUSE, Ubuntu
- Pricing Type: On-Demand, Reserved, Spot, Savings Plans
Cost Type Selection:
- Unblended: Actual costs before discounts
- Amortized: Spread RI/SP upfront costs over time
- DDE: Data Direct Exchange pricing
Interactive Charts:
- Service breakdown (bar charts showing cost distribution)
- Regional distribution (geographic cost analysis)
- Operating system mix (identify Windows licensing costs)
- Pricing type efficiency (measure reservation coverage)
Heatmap Visualization: Shows cost intensity by time and dimension for pattern identification.
Example Insights:
- "Windows instances cost 3x more than Linux—can we migrate?"
- "us-east-1 compute is 40% of total—can we use cheaper regions?"
- "Only 60% Reserved Instance coverage—opportunity for more RIs"
Storage Dashboard (S3)
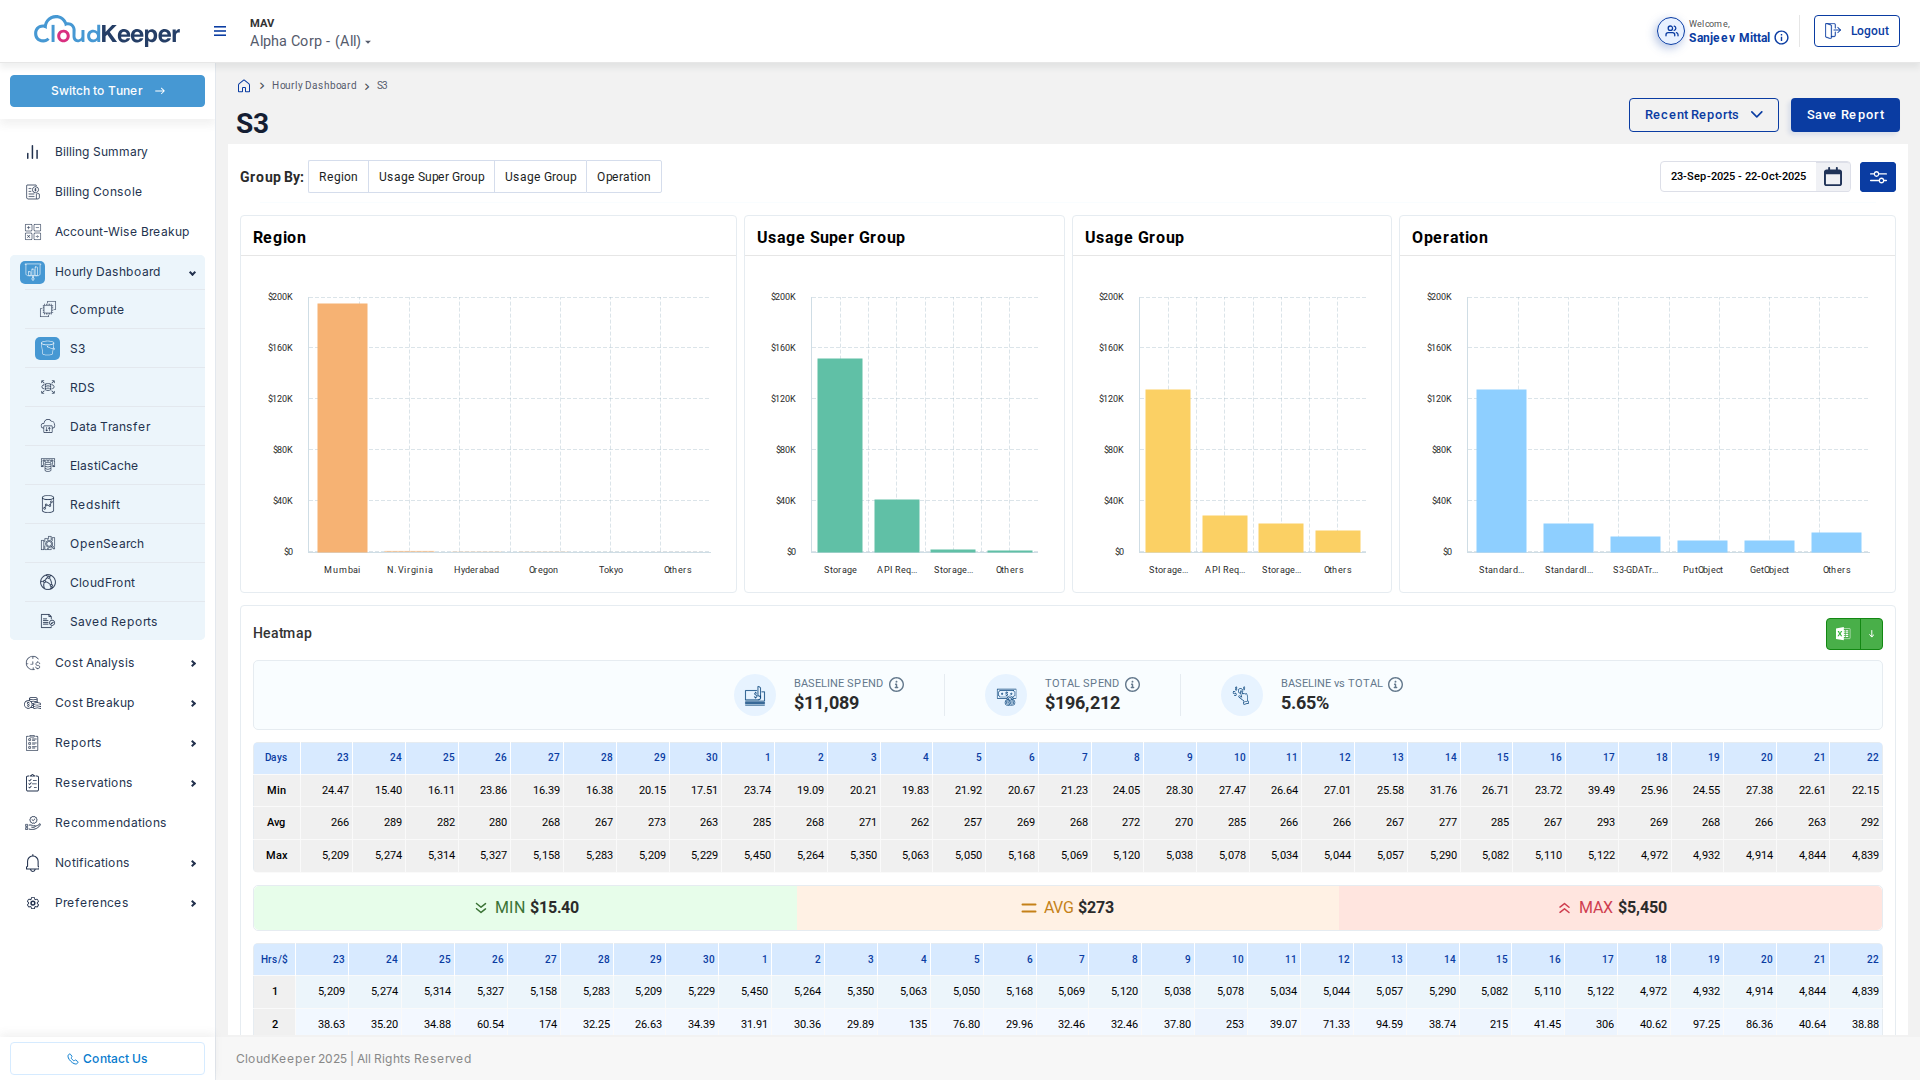
Purpose: S3 storage cost analysis and optimization.
Analysis Dimensions:
- Storage Class (Standard, IA, Glacier, Deep Archive)
- Bucket Name
- Region
- Request Costs (GET, PUT, DELETE)
Key Metrics:
- Storage volume (TB)
- Request counts
- Data transfer (ingress/egress)
- Storage class distribution
Optimization Opportunities:
- Lifecycle policies to move data to cheaper storage classes
- Intelligent-Tiering adoption
- Unnecessary bucket identification
Database Dashboard (RDS)
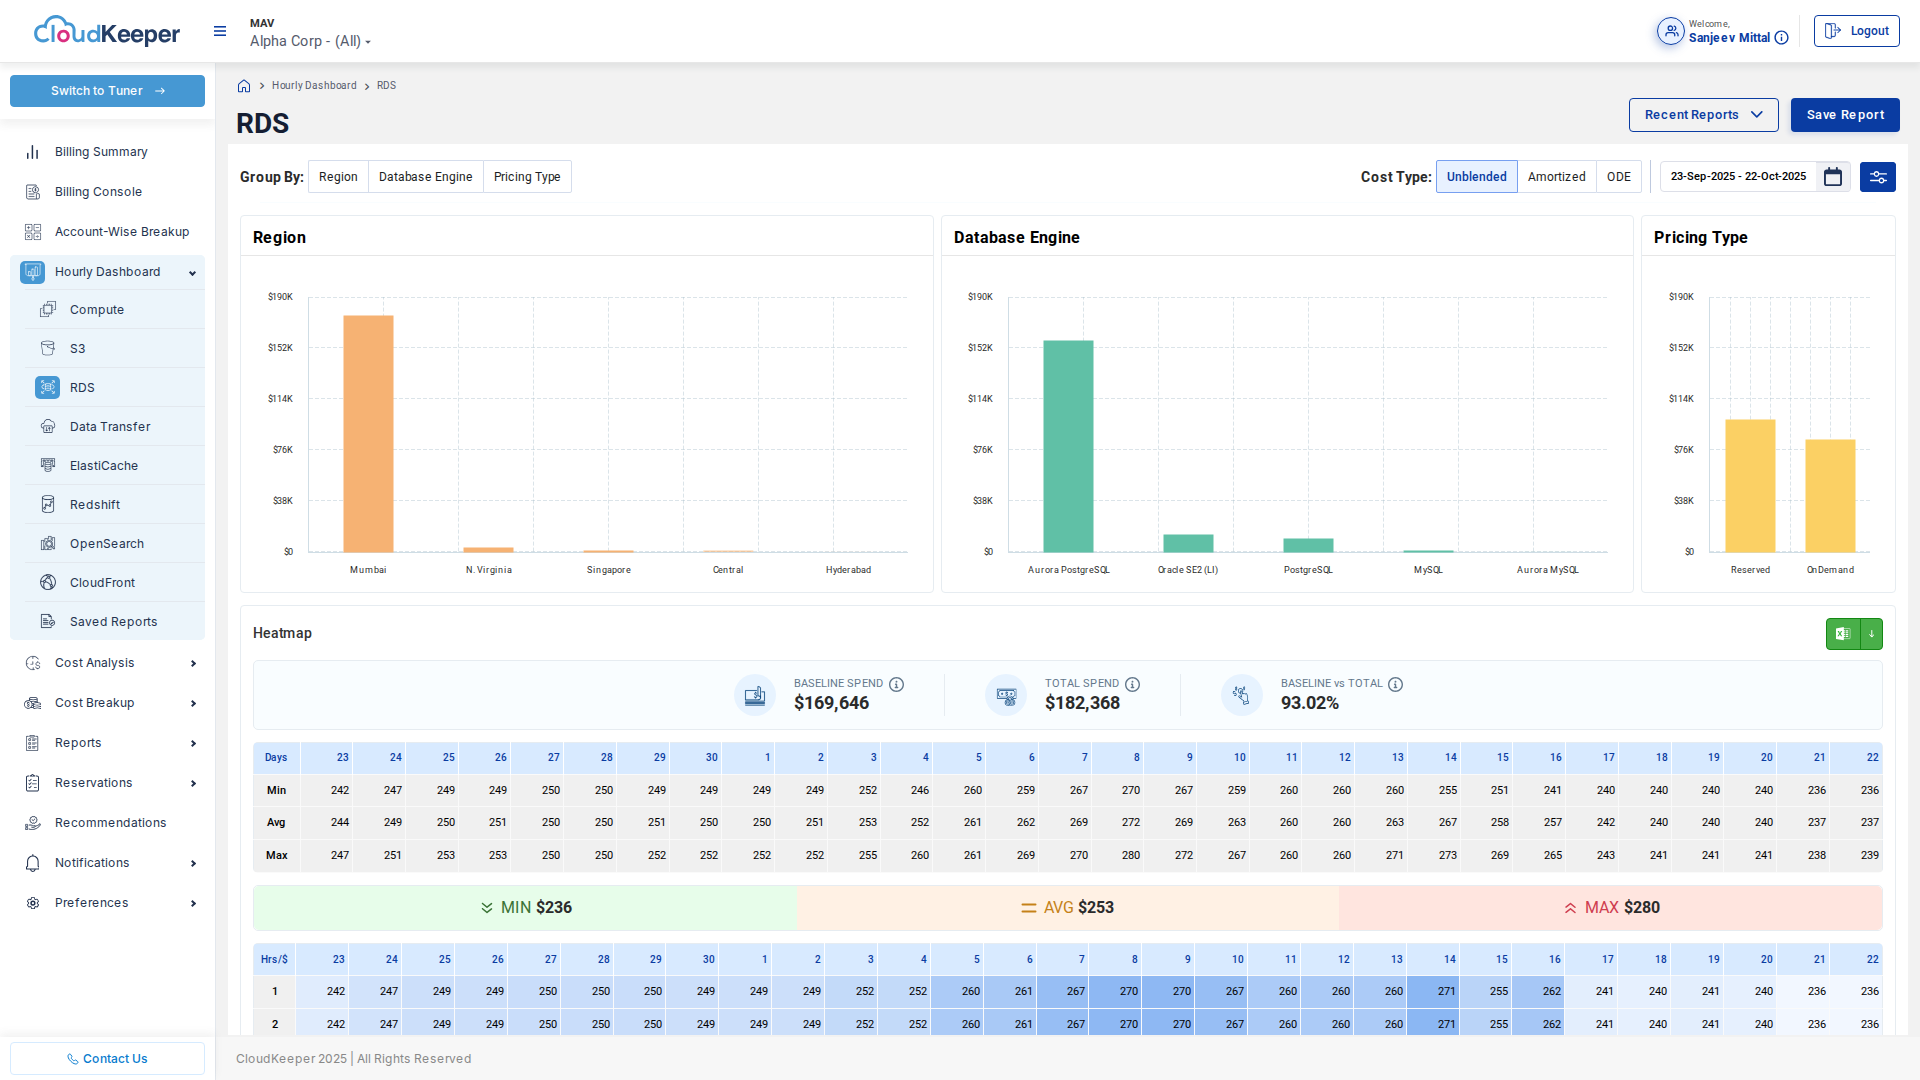
Purpose: RDS, Aurora, and other database cost analysis.
Analysis Dimensions:
- Database Engine (MySQL, PostgreSQL, Oracle, SQL Server, Aurora)
- Instance Type (db.r5.xlarge, db.t3.medium, etc.)
- Deployment (Single-AZ, Multi-AZ)
- Region
Key Metrics:
- Instance hours
- Storage costs (EBS volumes)
- Backup costs
- Data transfer costs
Optimization Opportunities:
- Right-size over-provisioned instances
- Reserved Instance purchases
- Multi-AZ vs Single-AZ cost trade-offs
Data Transfer Dashboard
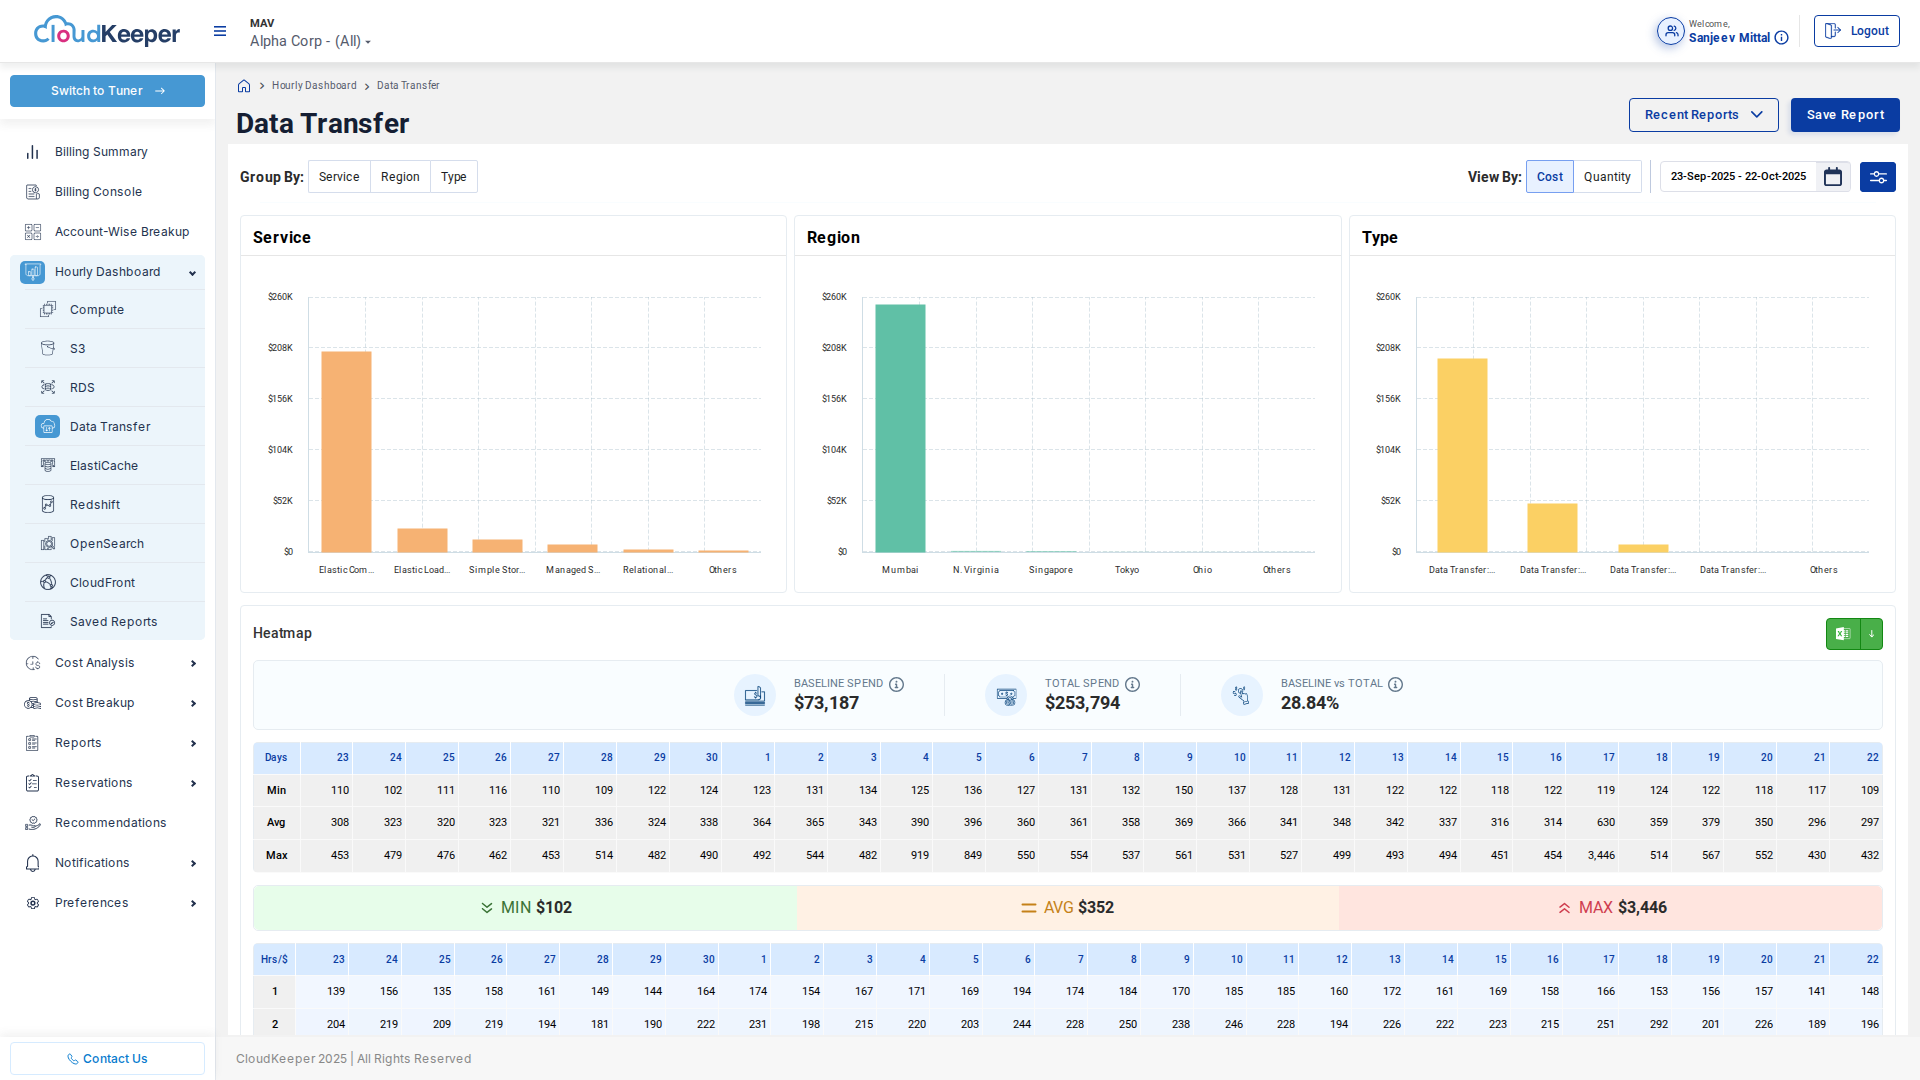
Purpose: Network data transfer cost analysis (often 10-15% of AWS bill).
Analysis Dimensions:
- Transfer Type (inter-region, internet egress, CloudFront)
- Source Region
- Destination Region
- Service (EC2, S3, RDS generating transfer)
Key Metrics:
- Data volume transferred (GB/TB)
- Cost per GB
- Top transfer routes
Optimization Opportunities:
- Use CloudFront CDN to reduce origin transfer
- Consolidate resources in same region
- Optimize cross-region replication
Additional Service Dashboards
AWS Lens includes specialized dashboards for:
- ElastiCache (/img/lens/screenshots/09-elasticache.png): Redis and Memcached analysis
- Redshift (/img/lens/screenshots/10-redshift.png): Data warehouse cost tracking
- OpenSearch (/img/lens/screenshots/11-opensearch.png): Search service analysis
- CloudFront (/img/lens/screenshots/12-cloudfront.png): CDN cost and usage
Each dashboard follows the same multi-dimensional analysis pattern, tailored to the service's cost drivers.
Cost Explorer & Analytics
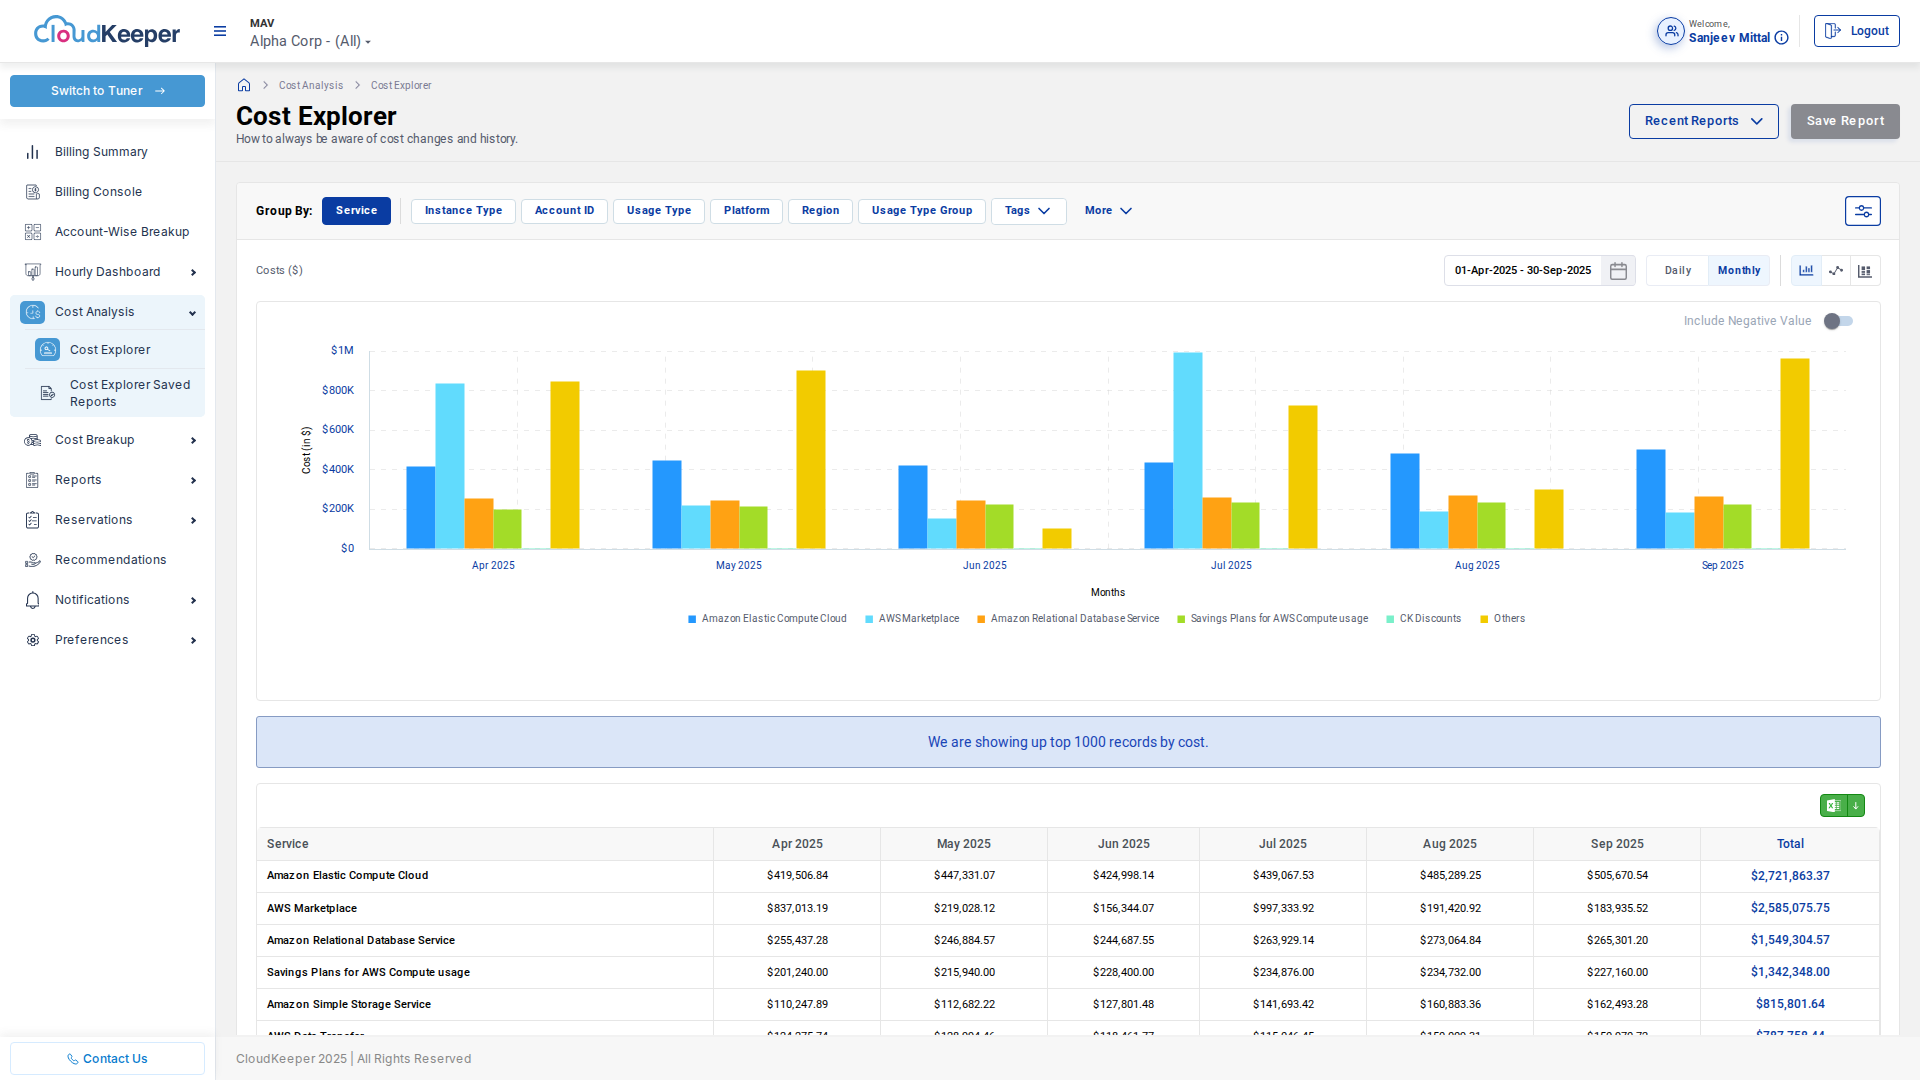
Purpose: Interactive cost analysis tool—think "AWS Cost Explorer on steroids."
Grouping Dimensions
Analyze costs by any combination of:
| Dimension | Examples |
|---|---|
| Service | EC2, S3, RDS, Lambda, etc. |
| Instance Type | t3.micro, r5.xlarge, c5.2xlarge |
| Account | Production, Staging, Development accounts |
| Usage Type | BoxUsage (compute), DataTransfer-Out, Storage |
| Platform | Linux, Windows, RHEL |
| Region | us-east-1, eu-west-1, ap-south-1 |
| Usage Type Group | EC2 Instances, Data Transfer, Storage |
| Tags | Environment, Team, Project, Cost Center |
Date Range Options
- Pre-defined: Today, Yesterday, Last 7 Days, Last 30 Days, MTD, Last Month, Last 3 Months, Last 6 Months, Last 12 Months, YTD
- Custom: Any date range from billing history start to today
Visualization Options
- Grouped Chart: Stacked bar chart showing cost breakdown
- Trend Chart: Line chart showing spending over time
- Pie Chart: Proportional cost distribution
- Table View: Detailed tabular data with export
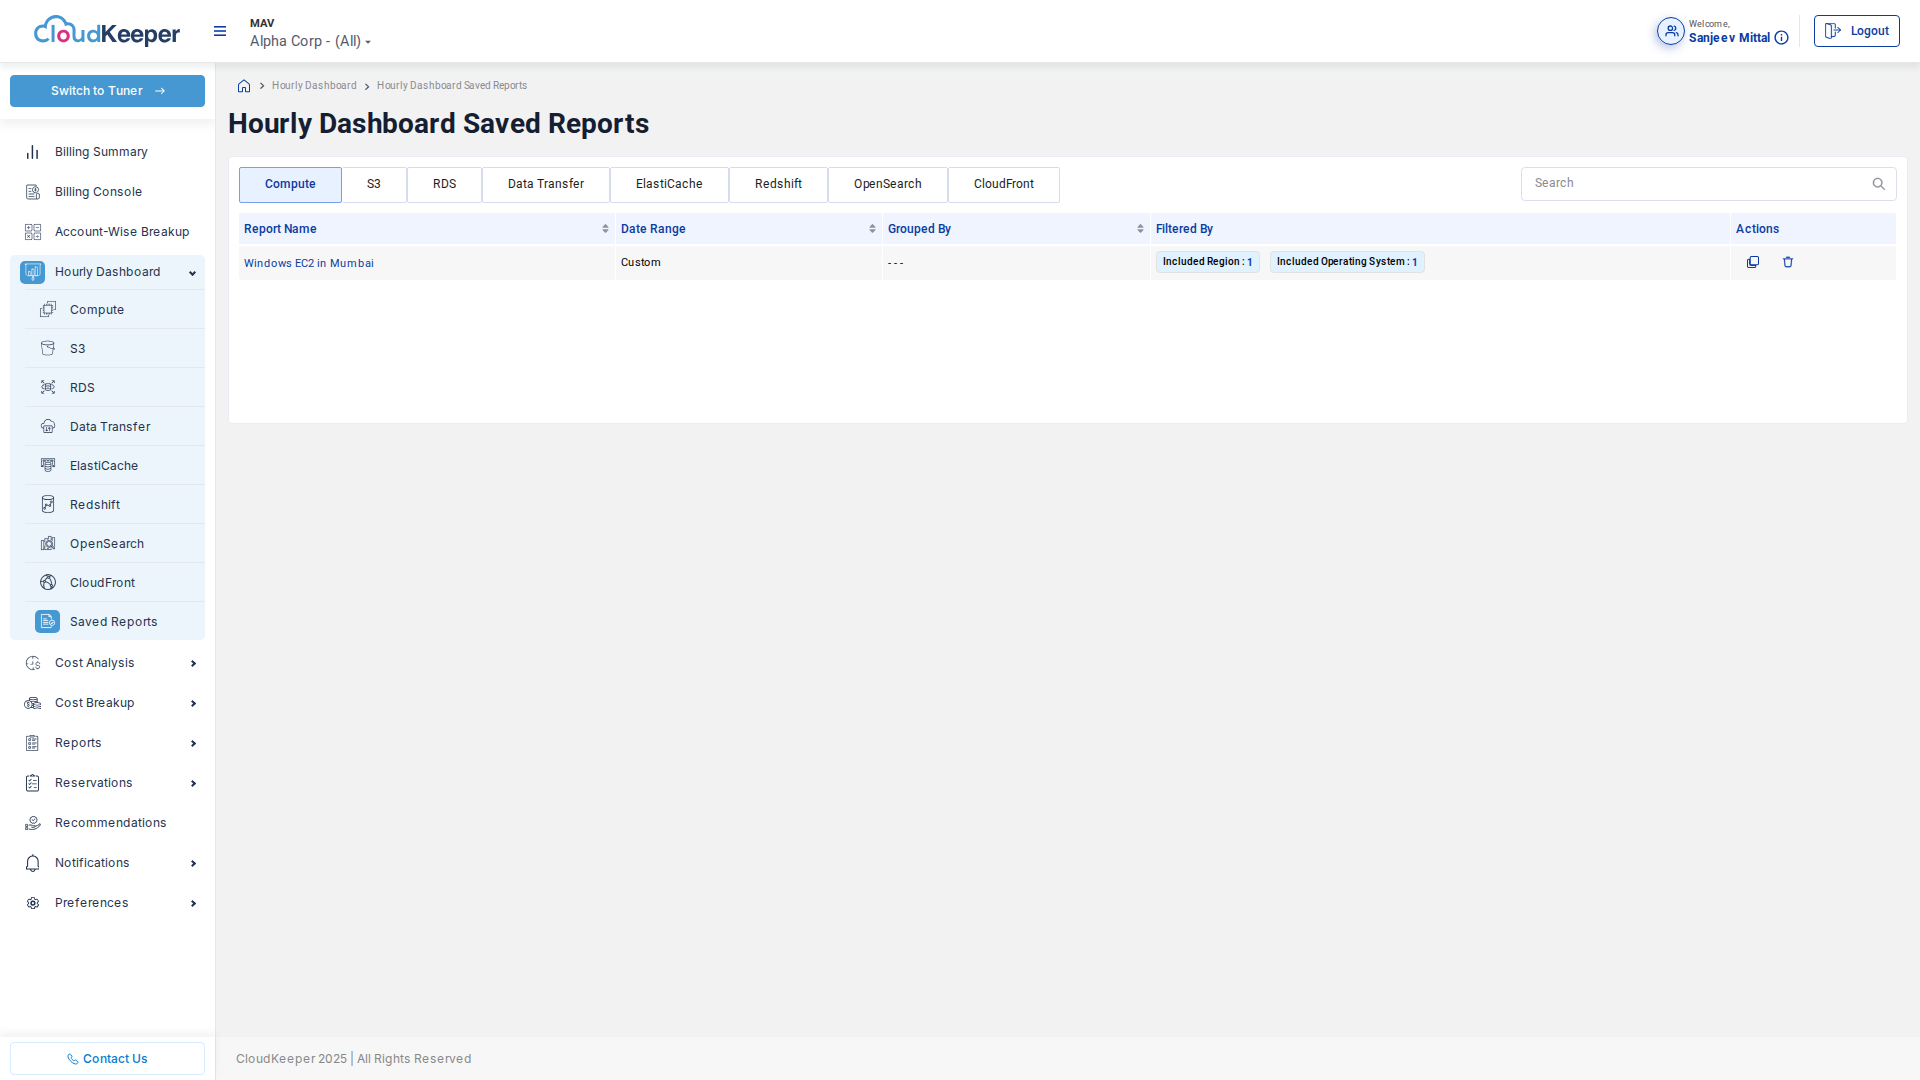
Saved Reports
Purpose: Bookmark frequently-used analyses for quick access.
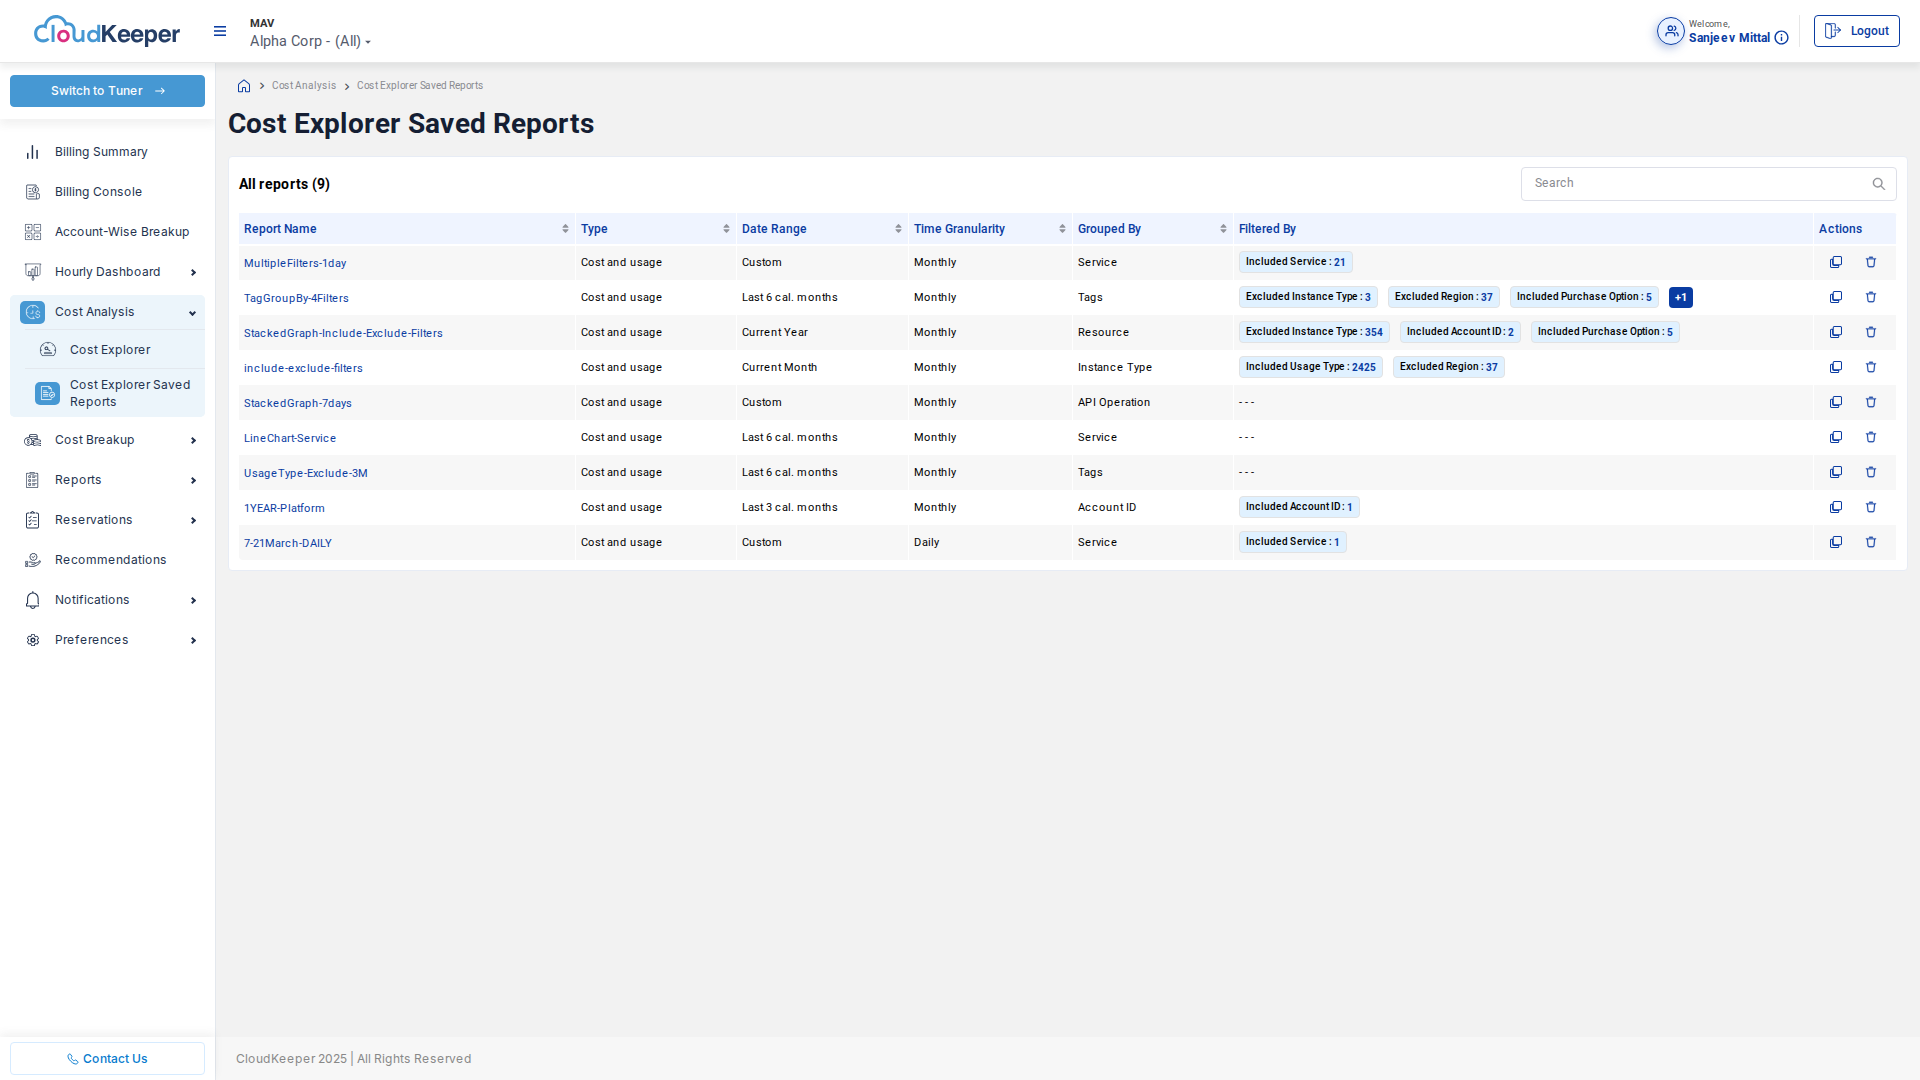
Features:
- Save any Cost Explorer query with filters
- Name and describe reports
- Share reports with team members
- Schedule automatic regeneration
Example Saved Reports:
- "Production Environment Monthly Costs by Service"
- "Data Transfer Costs by Region (Last 90 Days)"
- "Engineering Team Costs (Tag-based)"
- "Windows vs Linux Compute Cost Comparison"
Reservation Intelligence
Reservations Summary
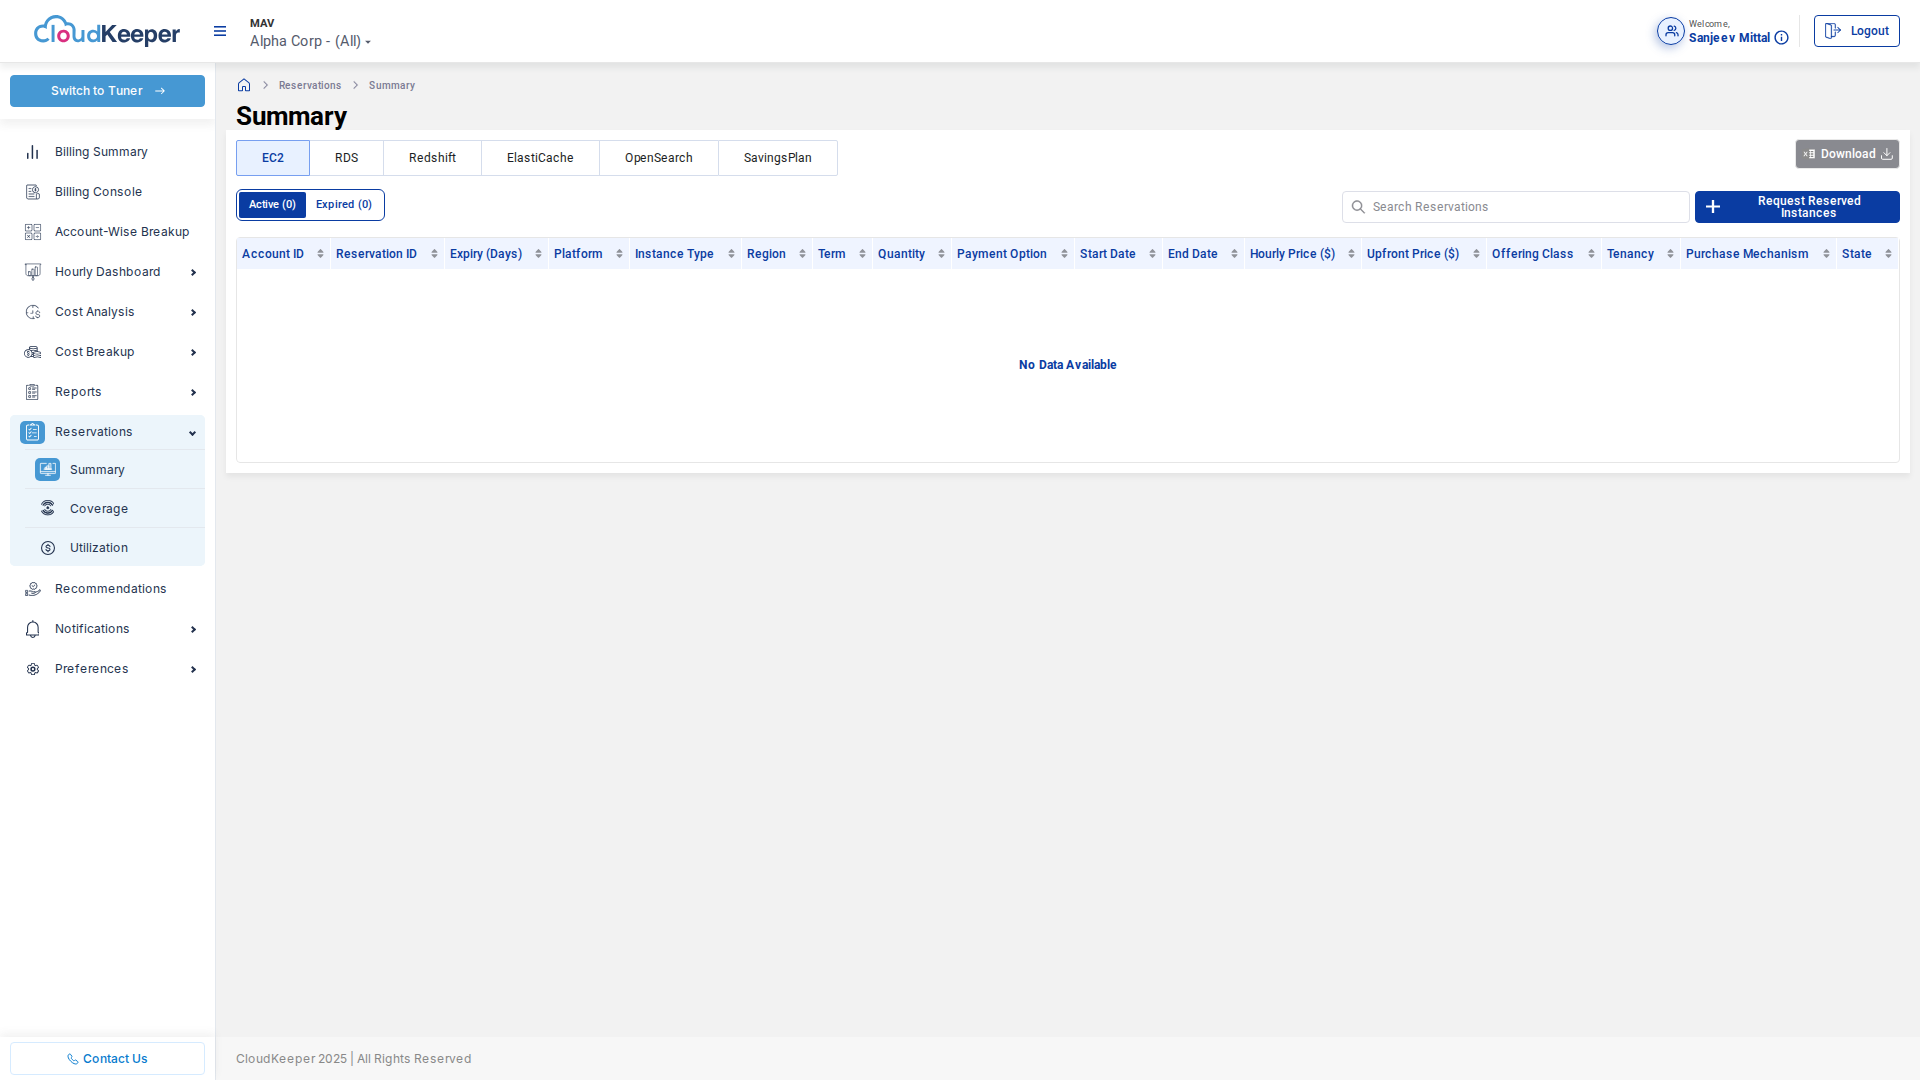
Purpose: Portfolio view of Reserved Instances and Savings Plans.
Key Metrics:
- Total RI Investment: Upfront and ongoing costs
- Active Reservations: Count and types
- Expiring Soon: Reservations needing renewal decisions
- Coverage %: Percentage of eligible usage covered
Reservation Types:
- EC2 Reserved Instances (Standard, Convertible)
- RDS Reserved Instances
- ElastiCache Reserved Nodes
- Redshift Reserved Nodes
- Compute Savings Plans
- EC2 Instance Savings Plans
- SageMaker Savings Plans
Utilization Tracking
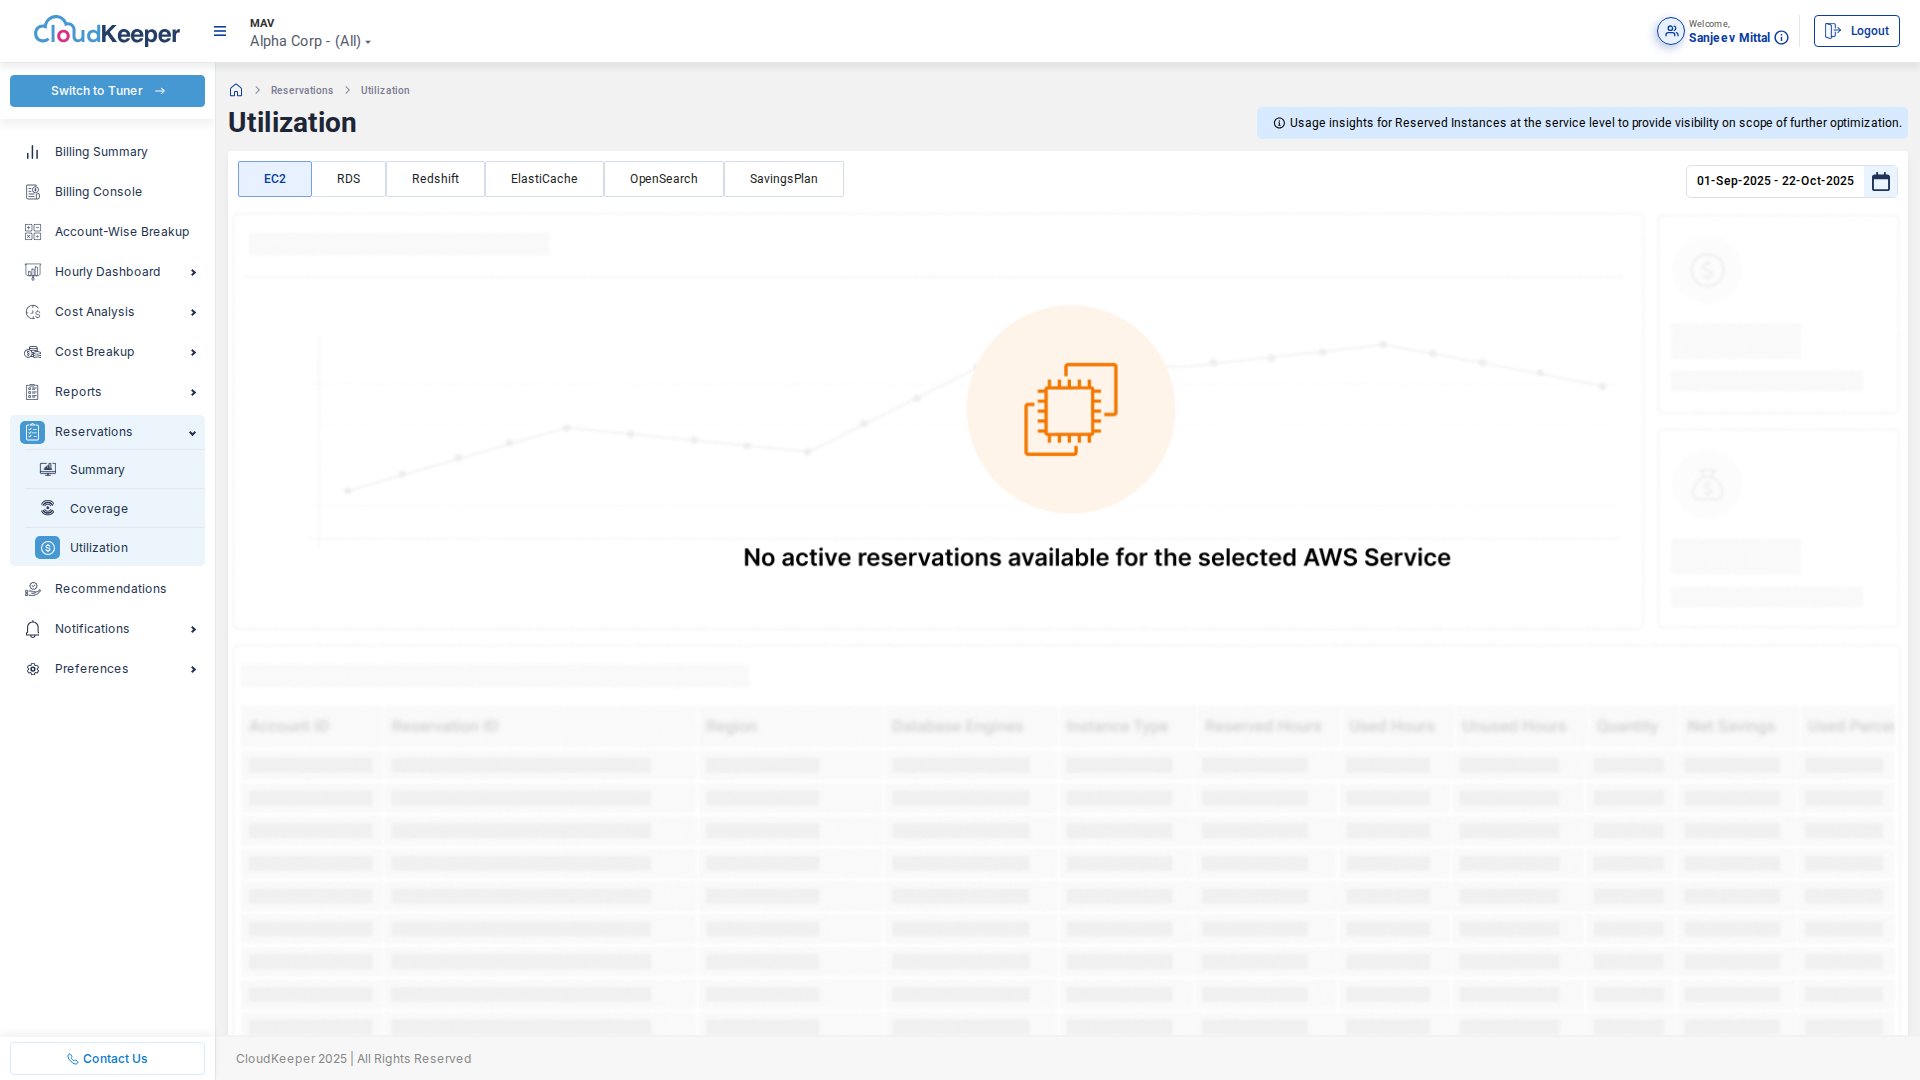
Purpose: Monitor reservation usage to ensure ROI.
Key Metrics:
- Utilization %: How much of purchased capacity is actually used
- Coverage %: What percentage of eligible usage is covered by reservations
- On-Demand Equivalent: What these resources would cost at on-demand rates
- Net Savings: Actual savings realized from reservations
Alerts:
- Low utilization warnings (below 80%)
- Coverage gap notifications
- Expiration reminders (60, 30, 7 days)
Optimization Actions:
- High Utilization (above 95%): Consider purchasing more
- Low Utilization (below 70%): Consider modifying or selling on RI Marketplace
- Low Coverage (below 60%): Opportunities for new RIs/SPs
Cost Optimization Engine
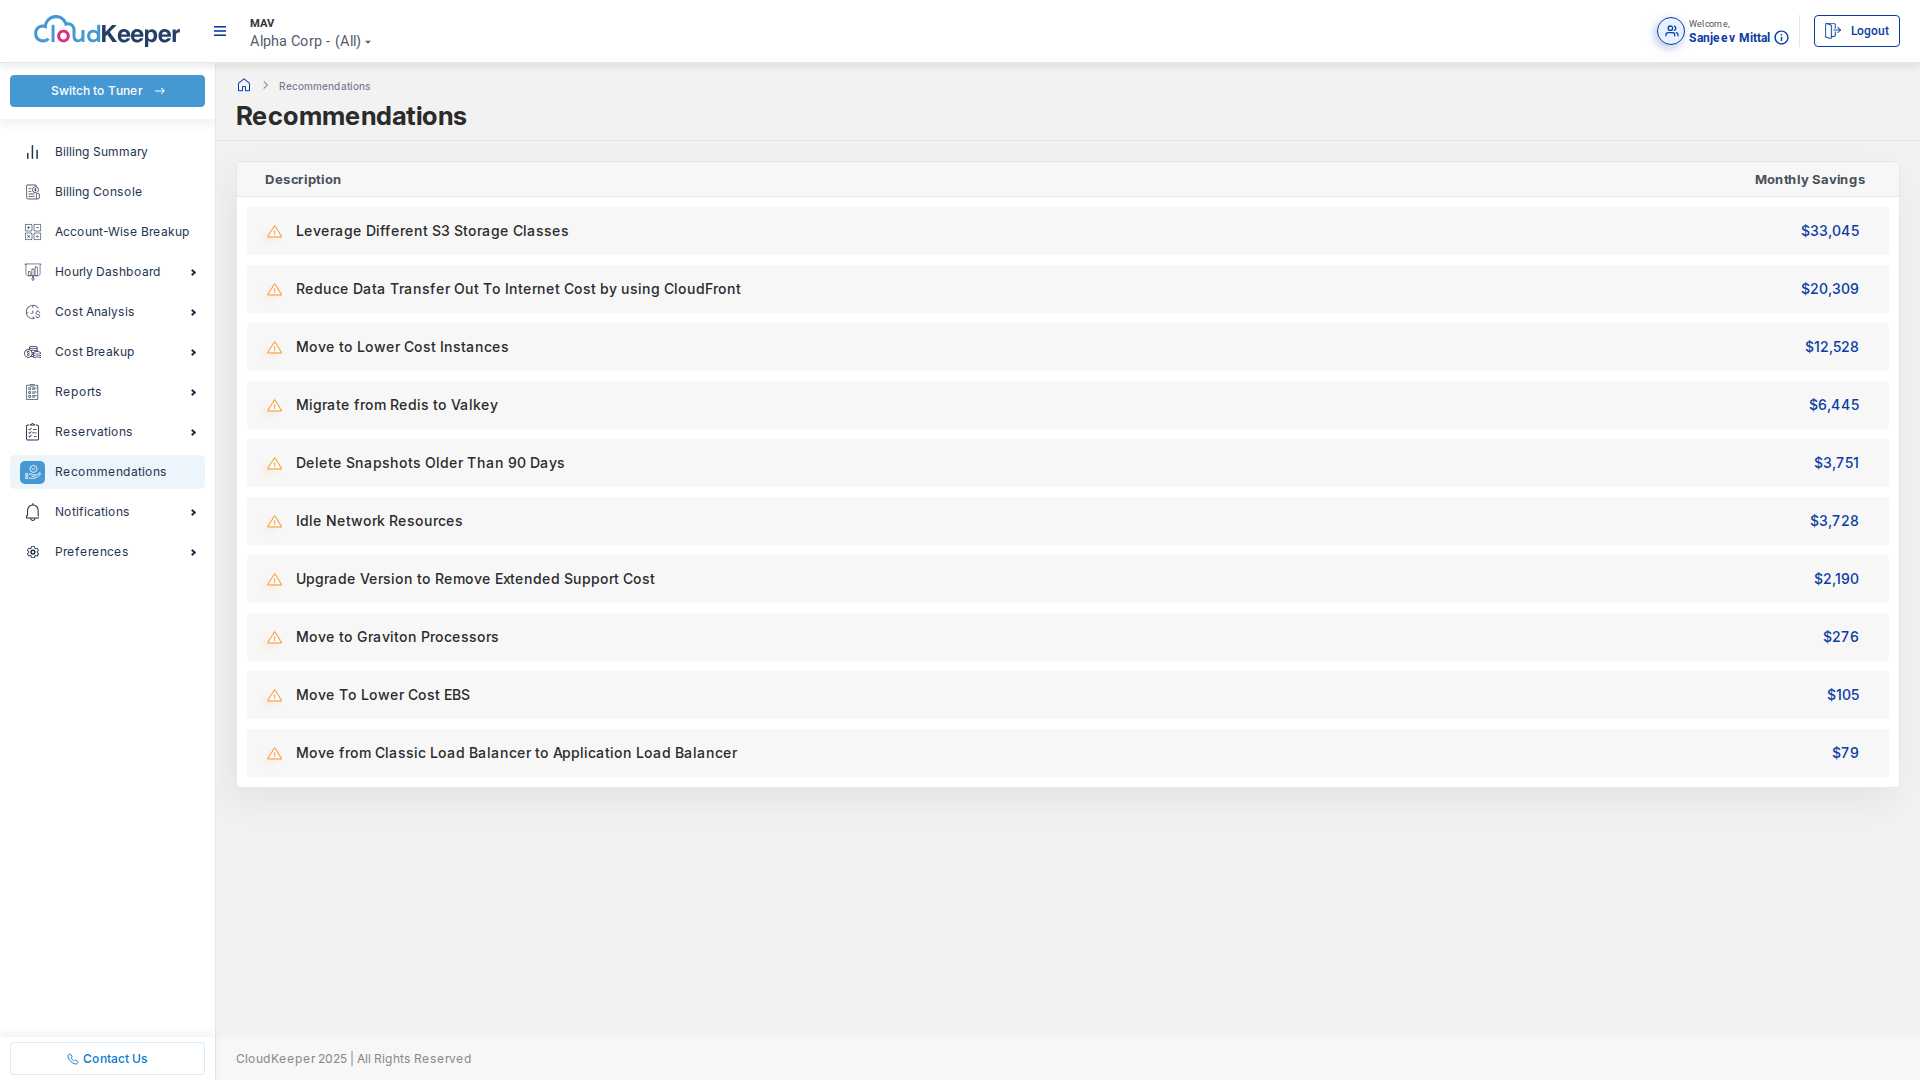
Purpose: AI-driven identification of cost reduction opportunities.
Recommendation Categories
1. Storage Optimization
Example: Leverage Different S3 Storage Classes
- Monthly Savings: $33,045
- Description: Move infrequently accessed S3 objects to Standard-IA or Glacier
- Implementation: Apply S3 Lifecycle policies
- Effort: Low (configuration change)
- Risk: Very Low (automated by AWS)
2. Network Optimization
Example: Reduce Data Transfer with CloudFront
- Monthly Savings: $20,309
- Description: Use CloudFront CDN to cache content closer to users
- Implementation: Create CloudFront distribution
- Effort: Medium (requires CDN setup and testing)
- Risk: Low (improves performance while reducing cost)
3. Compute Right-Sizing
Example: Move to Lower Cost Instances
- Monthly Savings: $12,528
- Description: Right-size over-provisioned EC2 instances based on CPU/memory utilization
- Implementation: Change instance types during maintenance window
- Effort: Medium (requires testing)
- Risk: Low if based on actual utilization data
4. Database Optimization
Example: Migrate from Redis to Valkey
- Monthly Savings: $6,445
- Description: Migrate to open-source Valkey (Redis-compatible)
- Implementation: Deploy Valkey, migrate data, switch applications
- Effort: High (application changes needed)
- Risk: Medium (requires testing)
5. Cleanup & Hygiene
Example: Delete Snapshots Older Than 90 Days
- Monthly Savings: $3,751
- Description: Remove old EBS snapshots no longer needed for backup
- Implementation: Audit snapshots, implement deletion policy
- Effort: Low (script-based cleanup)
- Risk: Medium (ensure backups not needed)
Example: Idle Network Resources
- Monthly Savings: $3,728
- Description: Terminate unused Elastic IPs, NAT Gateways, Load Balancers
- Implementation: Audit idle resources, schedule deletion
- Effort: Low (manual cleanup)
- Risk: Low (resources not in use)
6. Licensing Optimization
Example: Upgrade Version to Remove Extended Support Cost
- Monthly Savings: $2,190
- Description: Upgrade RDS databases to supported versions to avoid extended support fees
- Implementation: Plan and execute database upgrades
- Effort: High (requires testing)
- Risk: Medium (database upgrades have downtime)
Recommendation Workflow
1. Review Recommendations → Browse sorted list of opportunities
2. Assess Impact          → Evaluate savings vs effort vs risk
3. Prioritize             → Select high-impact, low-risk items first
4. Implement              → Follow step-by-step guidance
5. Track Savings          → Monitor actual savings realized
Continuous Learning
The recommendation engine continuously learns from:
- Your historical usage patterns
- Industry best practices
- AWS pricing changes
- New AWS services and features
As your infrastructure evolves, new recommendations appear automatically.
Multi-Account Management
Multi-Account View (MAV)
Purpose: Manage cost visibility across hundreds of AWS accounts.
Features:
Account Hierarchy
- Visualize AWS Organization structure (Organizational Units, accounts)
- Inherit policies from parent OUs
- Manage access at OU or account level
Cross-Account Analysis
- Compare spending across accounts
- Identify outliers (accounts with unusual spending)
- Aggregate costs by business unit, team, or environment
Account Groups
Create logical groups for reporting:
- By Environment: Production, Staging, Development, QA
- By Business Unit: Engineering, Marketing, Sales, Operations
- By Geography: US Accounts, EMEA Accounts, APAC Accounts
- By Project: Project Alpha, Project Beta, Project Gamma
Example: "Show me total production environment costs across all accounts in Engineering business unit"
Reporting & Alerts
Saved Reports
Purpose: Automated recurring cost reports delivered to stakeholders.
Report Types:
Standard Reports
- Monthly Cost Summary (by service, account, region)
- Daily Spend Report (for real-time monitoring)
- Weekly Trend Report (identify unusual patterns)
- RI/SP Utilization Report (ensure reservation ROI)
- Anomaly Report (unexpected cost spikes)
Custom Reports
Build reports matching your organization's needs:
- Chargeback reports (costs by cost center/business unit)
- Engineering team reports (costs by tag: Team=DataScience)
- Project-based reports (track project cloud spend)
- Service-specific reports (S3 costs only, RDS costs only)
Delivery Options:
- Email (PDF, CSV, Excel)
- Slack channel
- Microsoft Teams
- S3 bucket (for automated processing)
Scheduling:
- Daily at specified time
- Weekly on specific day
- Monthly on specific date
- On-demand manual generation
Alerts & Notifications
Alert Types:
Budget Alerts
- Threshold Alerts: Notify when spending reaches % of budget (50%, 75%, 90%, 100%)
- Forecast Alerts: Warn if forecasted month-end spend will exceed budget
- Period-over-Period: Alert on unusual % increase vs previous period
Anomaly Alerts
- Service Anomalies: Unusual spending in specific service (e.g., S3 spike)
- Account Anomalies: Unusual activity in specific account
- Regional Anomalies: Unexpected costs in specific region
Reservation Alerts
- Low Utilization: RI/SP usage below threshold (below 75%)
- Expiration: Reservation expiring in 60/30/7 days
- Coverage Gap: Opportunity to purchase more reservations
Alert Channels:
- Slack
- Microsoft Teams
- PagerDuty (for critical alerts)
- Webhook (for custom integrations)
Administration & Governance
User Management
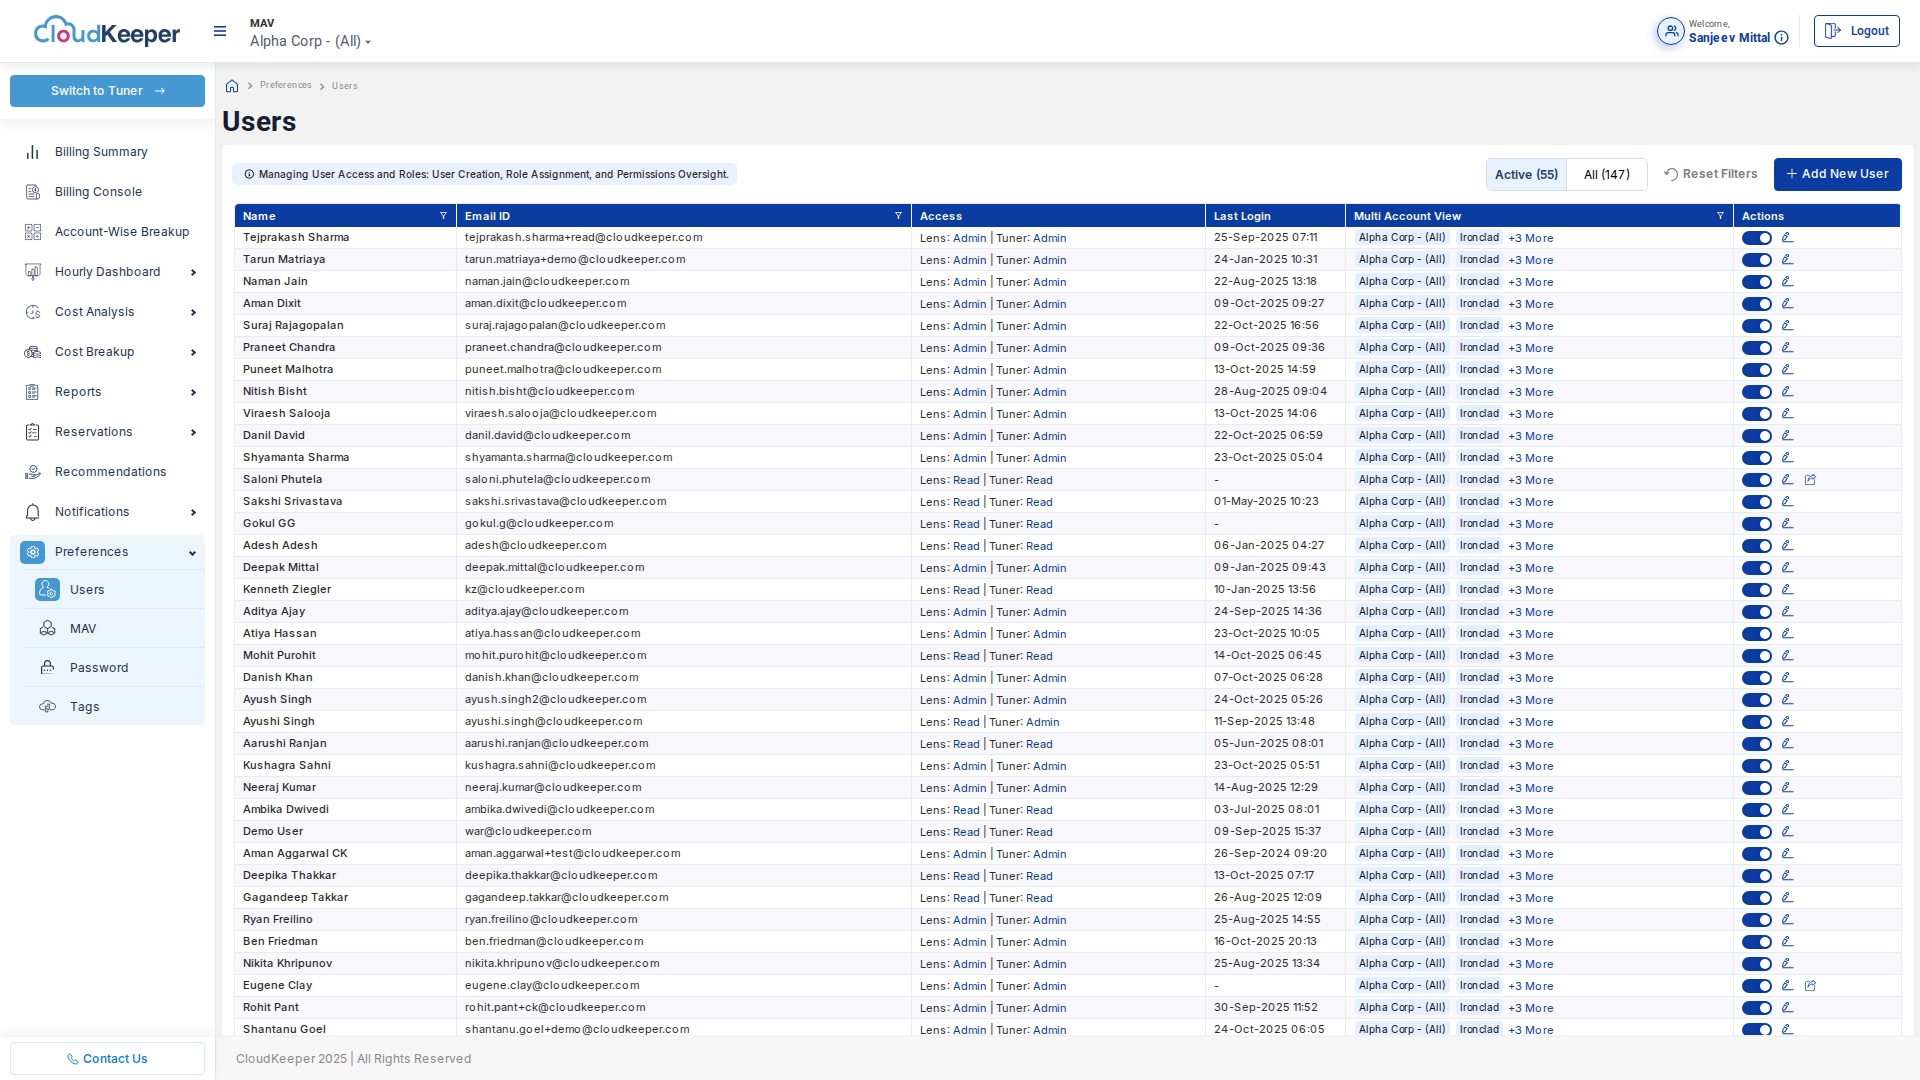
Purpose: Control access to cost data and features.
Features:
Role-Based Access Control (RBAC)
Define roles with specific permissions:
- Viewer: Read-only access to dashboards and reports
- Analyst: Viewer + ability to create custom reports and saved views
- Optimizer: Analyst + ability to acknowledge and implement recommendations
- Administrator: Full access including user management and settings
Multi-Tenancy
- Isolate cost data by business unit, geography, or environment
- Users only see costs for their assigned accounts/tags
- Ensure compliance with data privacy requirements
SSO Integration
- SAML 2.0: Integrate with Okta, Azure AD, Auth0, OneLogin
- OAuth: Google Workspace, Microsoft 365
- LDAP: On-premise Active Directory
Tag Management
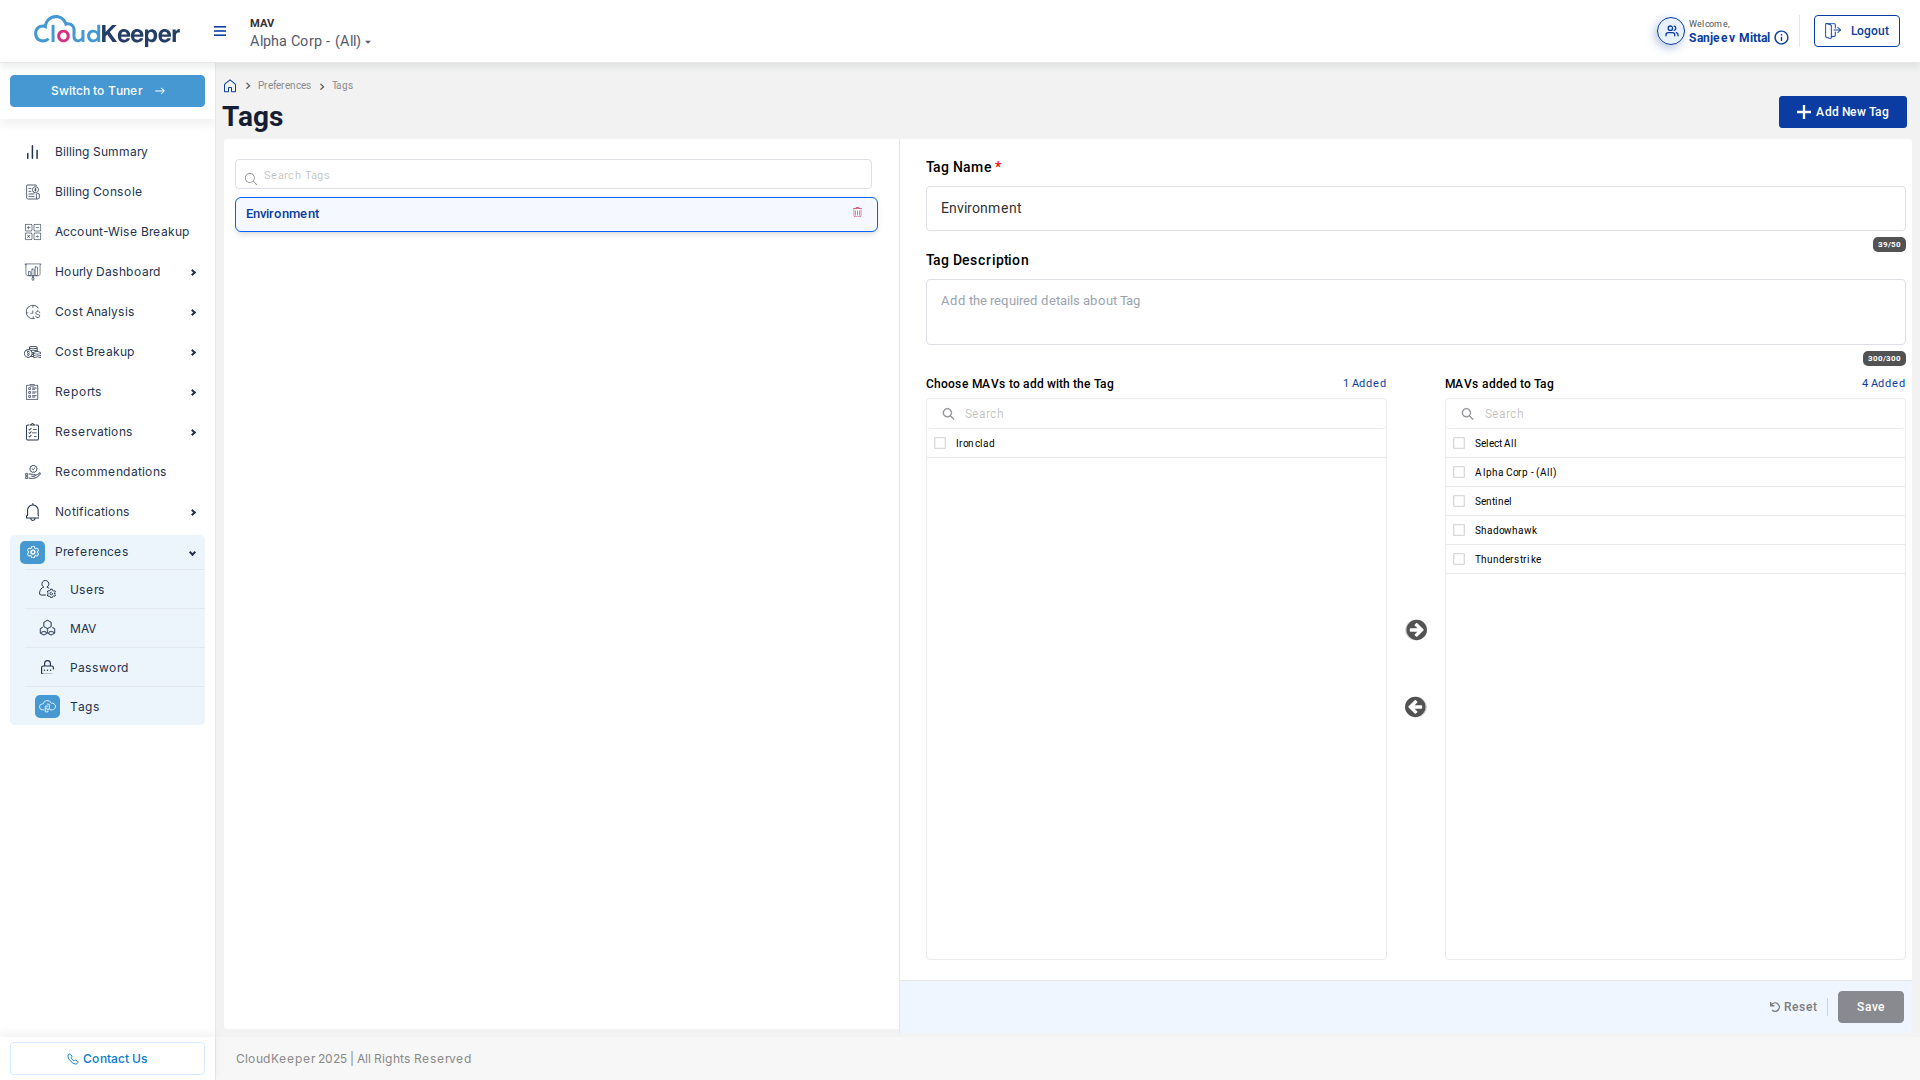
Purpose: Enforce tagging policies for accurate cost allocation.
Features:
Tag Discovery
- Automatically discover all tags used across AWS accounts
- Identify untagged resources
- Suggest standard tag keys
Tag Policies
- Define required tags (Environment, Owner, CostCenter, Project)
- Set allowed values (Environment: Production|Staging|Development)
- Alert on non-compliant resources
Cost Allocation Tags
- Activate AWS cost allocation tags
- Create virtual tags (combine multiple tags)
- Map tags to business units or cost centers
Example Tag Hierarchy:
Environment: Production
  ├─ Business Unit: Engineering
  │   ├─ Team: Backend
  │   ├─ Team: Frontend
  │   └─ Team: Data Engineering
  └─ Business Unit: Operations
      ├─ Team: DevOps
      └─ Team: SRE
Preferences & Configuration
System Preferences:
- Currency: USD, EUR, GBP, INR, etc.
- Date Format: MM/DD/YYYY, DD/MM/YYYY
- Timezone: For reports and alerts
- Fiscal Year: Calendar year or custom fiscal year
- Default Date Range: Dashboard default view (Last 30 Days, MTD, etc.)
Cost Display Options:
- Cost Type: Unblended, Amortized, Net Amortized
- Precision: Show costs to 2, 3, or 4 decimal places
- Include Credits: Include/exclude AWS credits in totals
- Include Refunds: Include/exclude refunds
Notification Preferences:
- Email digest frequency (daily, weekly, monthly)
- Alert quiet hours (don't send alerts overnight)
- Alert severity thresholds
Integration Capabilities
API Access
AWS Lens provides REST APIs for:
- Cost Data: Programmatic access to cost and usage data
- Recommendations: Fetch optimization recommendations
- Reports: Generate reports on-demand
- Alerts: Configure and manage alerts
- User Management: Automate user provisioning
Use Cases:
- Embed cost widgets in internal portals
- Integrate cost data into business intelligence tools
- Build custom automation workflows
- Create CI/CD cost gates
Data Export
Export Formats:
- CSV (for Excel analysis)
- JSON (for programmatic processing)
- Parquet (for data warehouse loading)
- API (real-time access)
Export Destinations:
- S3 bucket (automated daily export)
- Snowflake (direct integration)
- Redshift (data warehouse)
- BigQuery (multi-cloud analytics)
Next Steps
Explore Related Documentation
- Use Cases & ROI Examples - See how organizations use these features
- Solution Architecture - Understand how AWS Lens works
- Deployment Guide - Get started with AWS Lens
Get Hands-On
- Demo Environment: https://demo-lens.cloudkeeper.com
- Username: sanjeev.mittal@cloudkeeper.com
- Password: s@njE3v98
- Free Trial: Contact CloudKeeper for trial access
- Proof of Concept: Evaluate AWS Lens with your actual AWS accounts
For questions about specific features or to request a demo, contact support@cloudkeeper.com