Business Value & ROI Examples
This document explores real-world use cases for AWS Tuner across different organizational roles and scenarios, demonstrating how intelligent cost optimization delivers measurable business value and rapid ROI.
Table of Contents
- For Finance & Executive Leadership
- For FinOps & Cloud Cost Teams
- For Engineering & DevOps
- For Enterprise Architects
- Industry-Specific Use Cases
- ROI Calculator & Business Case
For Finance & Executive Leadership
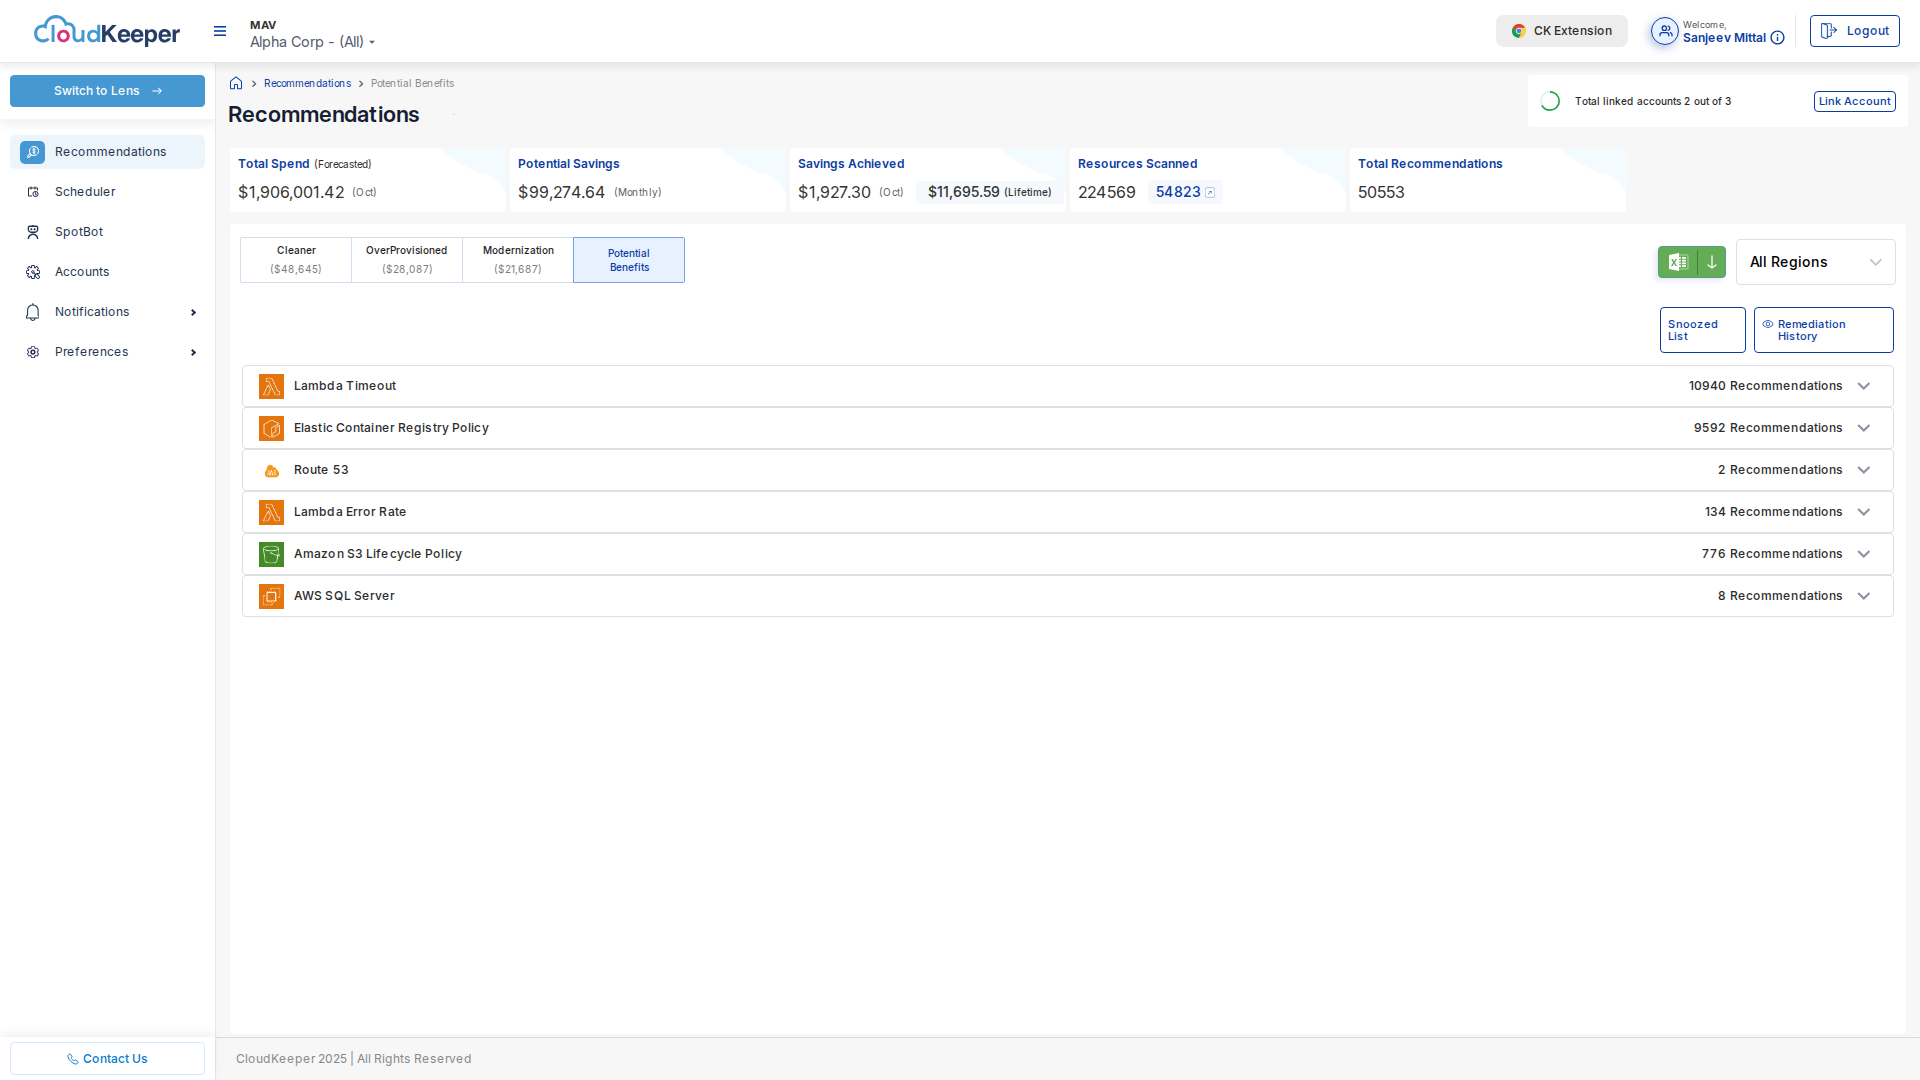
Use Case 1: Automated Waste Detection & Elimination
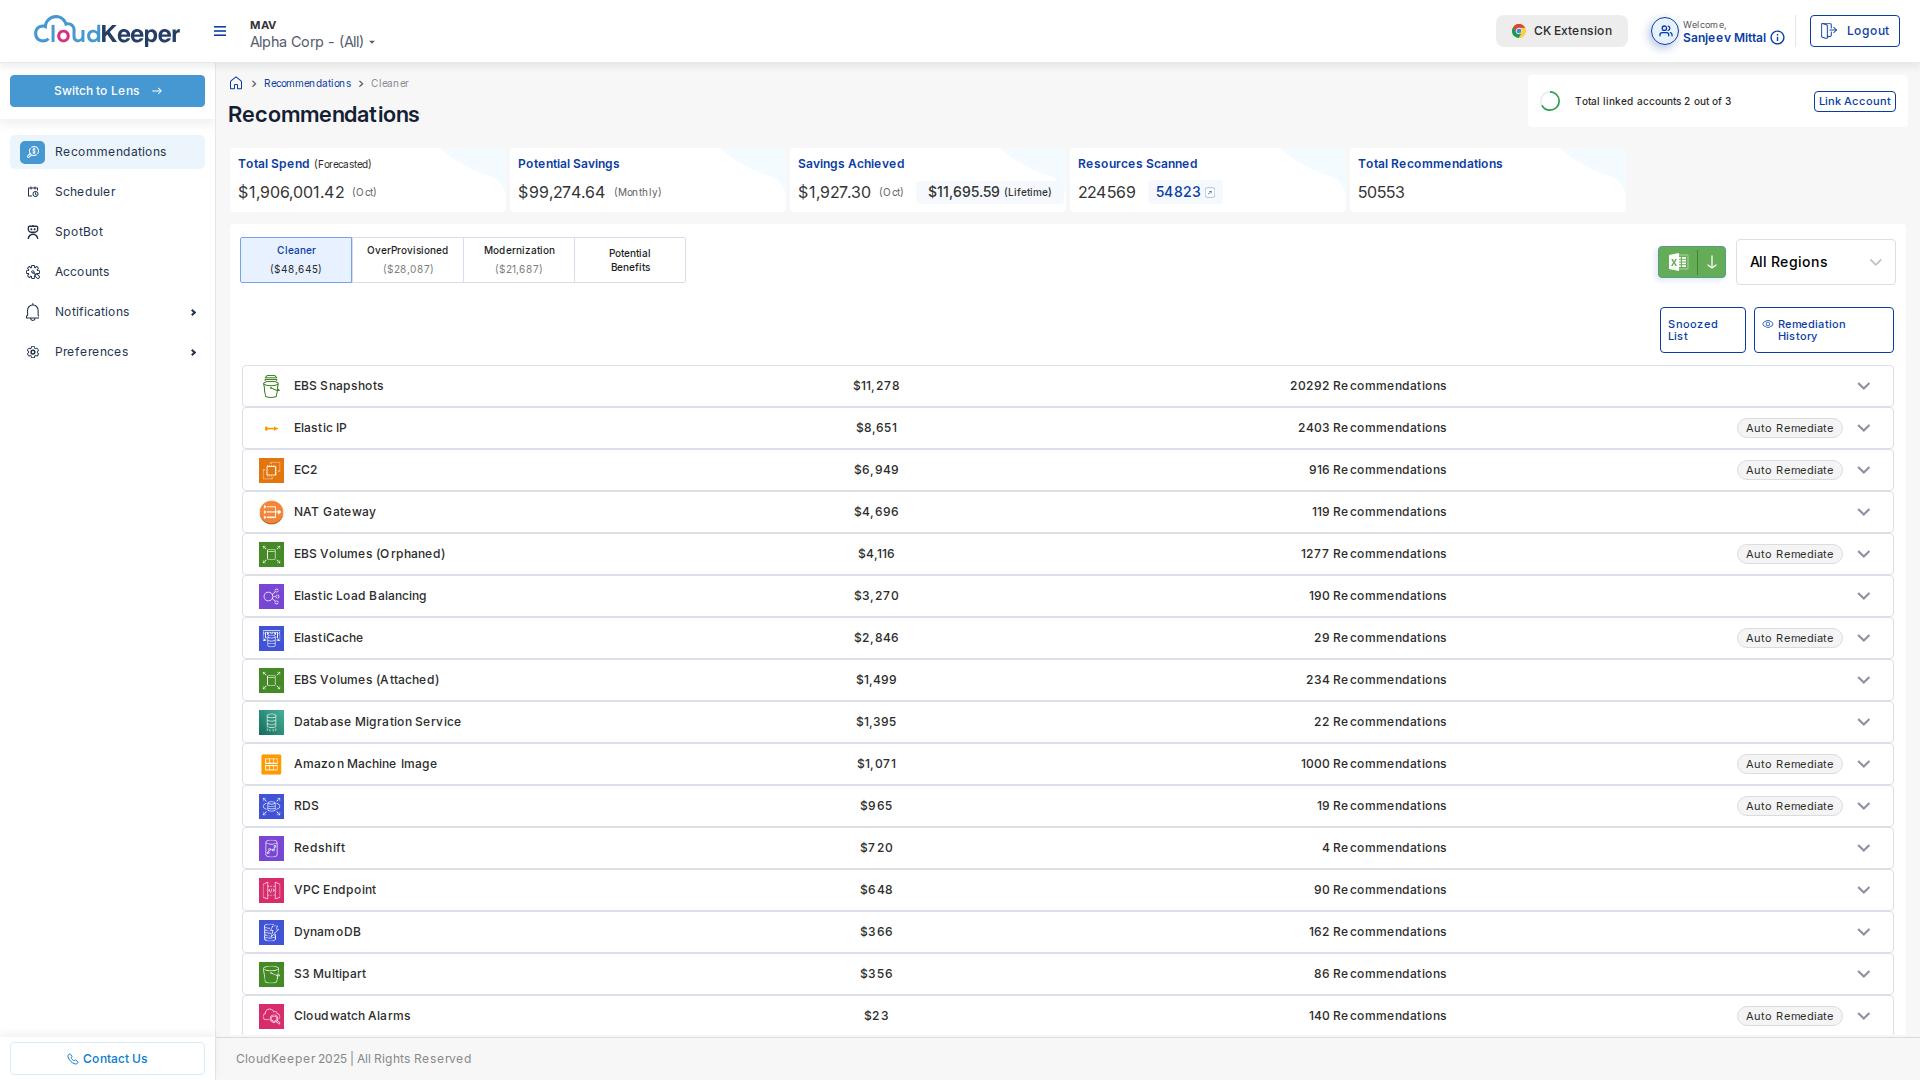
Challenge: A SaaS company with $3.2M annual AWS spend discovered they were paying $380K/year ($31K/month) for resources that provided zero business value - forgotten test environments, orphaned EBS snapshots, and idle NAT Gateways left running 24/7.
Solution with AWS Tuner:
-
Automated Discovery: Tuner identified 20,454 unused resources within 24 hours of onboarding
EBS Snapshots: $11,278/month (20,292 snapshots)
NAT Gateways:   $4,696/month (119 idle gateways)
VPC Endpoints:    $648/month (90 unused endpoints)
S3 Multipart:     $356/month (86 incomplete uploads)
DynamoDB: $366/month (162 idle tables) -
Prioritized Action Plan: Recommendations sorted by savings impact
- High impact, low risk: EBS snapshots (safe to delete if unattached)
- Medium impact, low risk: NAT Gateways with zero traffic
- Low impact, low risk: S3 multipart cleanup
-
Automated Remediation: Enabled for low-risk optimizations
- Week 1: Cleaned 18,000 EBS snapshots automatically → $9,200/month saved
- Week 2: Removed 98 idle NAT Gateways → $3,920/month saved
- Week 3: Deleted unused VPC endpoints → $580/month saved
Results:
- $13,700/month savings ($164K annually) from cleaner recommendations alone
- Zero infrastructure impact: All resources were truly unused
- 3 weeks to implement: vs. 6 months for manual audit
- Ongoing detection: New waste detected and eliminated monthly
ROI:
- Tool cost: $3,000/month
- Monthly savings: $13,700
- Net monthly benefit: $10,700
- Payback period: 8.2 days
- Annual ROI: 447%
Use Case 2: Non-Production Schedule Automation
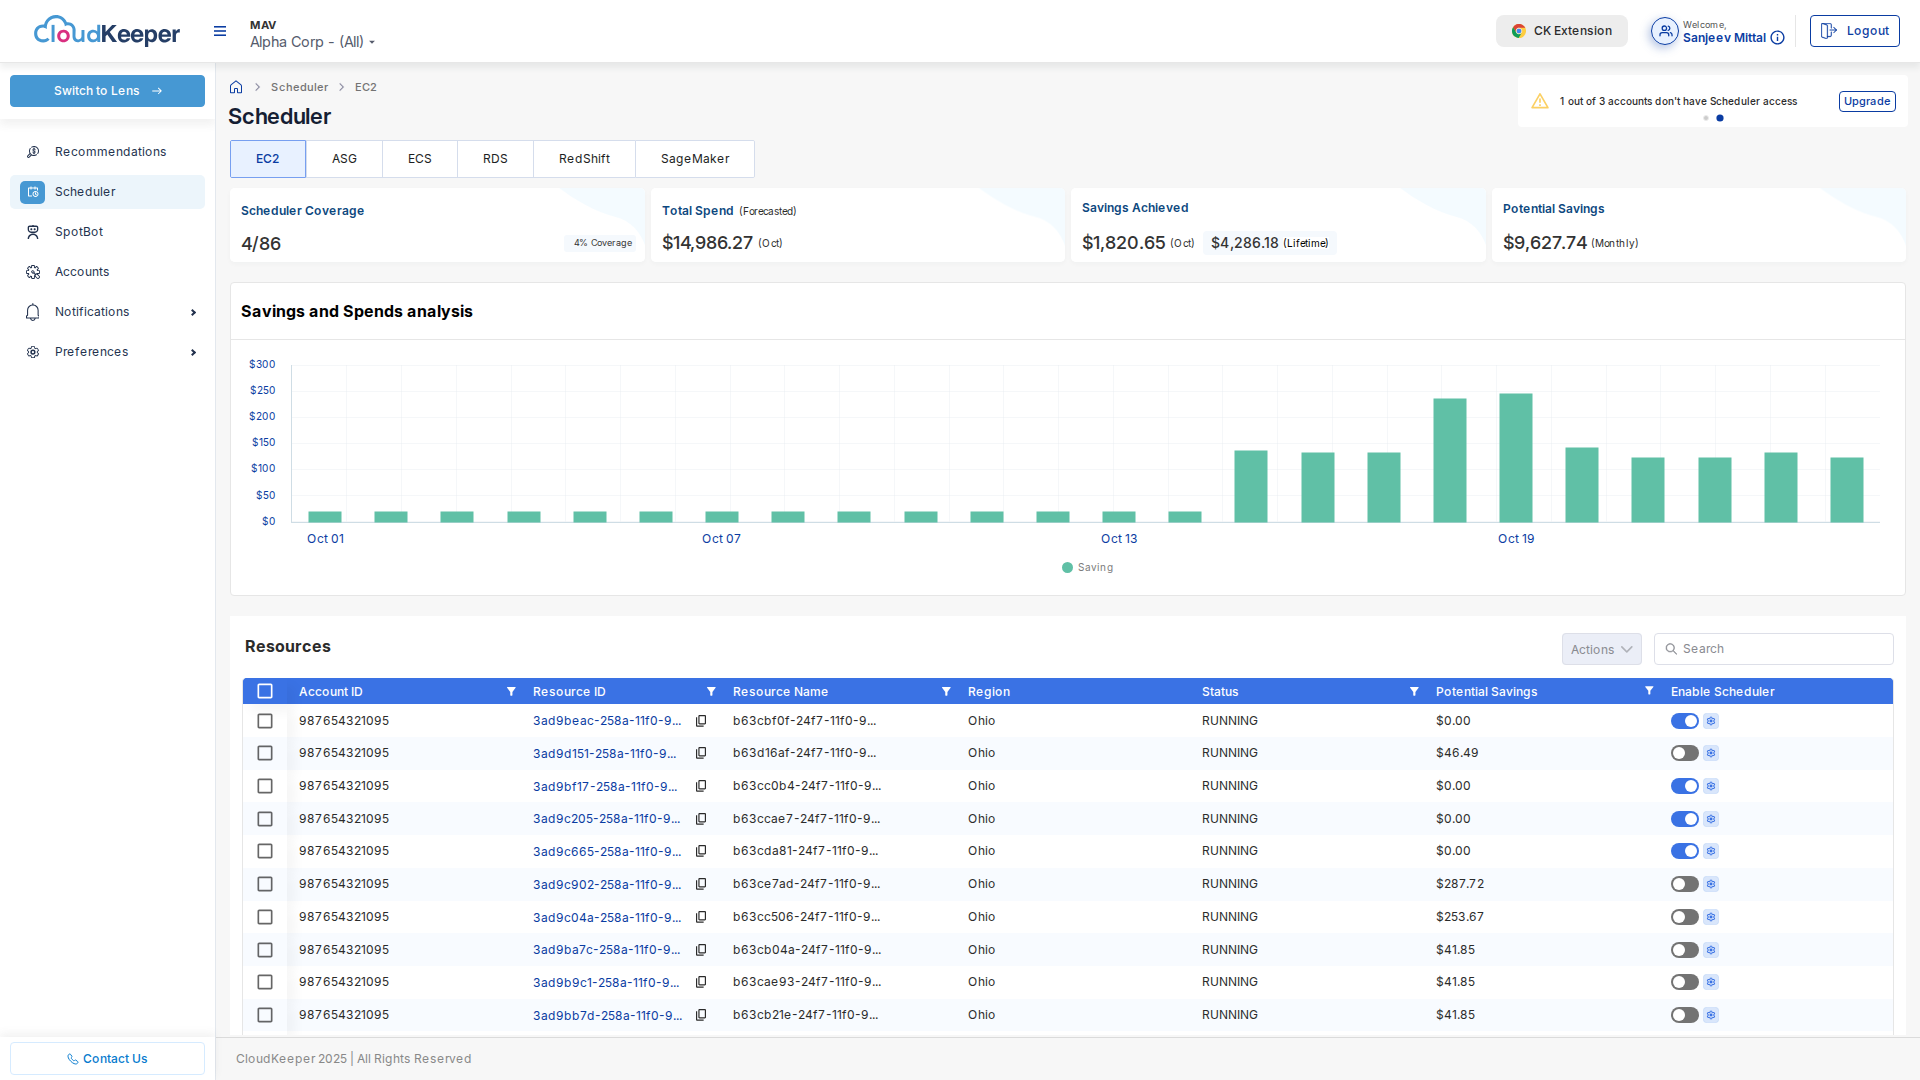
Challenge: A healthcare technology company had 200+ EC2 instances and 45 RDS databases in development and staging environments running 24/7, despite teams only working Monday-Friday, 8 AM - 7 PM. Annual cost: $1.2M for non-production infrastructure.
Solution with AWS Tuner Scheduler:
-
Schedule Configuration:
Dev Environment (150 EC2 + 30 RDS):
- Start: Monday 7:00 AM
- Stop: Friday 8:00 PM
- Weekend: Completely off (62 hours)
- Nights: Off 13 hours/night × 5 nights = 65 hours
- Total off: 127 hours/week (75.6%)

Staging Environment (50 EC2 + 15 RDS):
- Start: Monday-Friday 7:00 AM
- Stop: Monday-Friday 9:00 PM
- Weekend: Off
- Total off: 81 hours/week (48.2%) -
Tag-Based Automation: No manual resource selection needed
- All resources tagged
Environment=Devfollow dev schedule - All resources tagged
Environment=Stagingfollow staging schedule - Production tagged
Environment=Prodexcluded automatically
- All resources tagged
-
Safety Features:
- Retry mechanism for failed stop/start operations
- Email alerts if resource fails to start Monday morning
- Audit log of all scheduled actions
- Override capability for urgent weekend work
Results:
- Dev savings: 150 EC2 @ $0.10/hr avg × 127 hrs/week × 4.3 weeks = $81,795/month
- Dev RDS savings: 30 RDS @ $0.15/hr avg × 127 hrs/week × 4.3 weeks = $24,538/month
- Staging savings: Combined $35,280/month
- Total monthly savings: $141,613
- Annual savings: $1,699,356
Productivity Impact:
- No developer impact: Resources automatically available during work hours
- Faster starts: Developers no longer waste time starting instances manually
- Consistent schedules: Eliminates "forgot to turn it off" situations
ROI:
- Tool cost: $3,000/month
- Monthly savings: $141,613
- Net monthly benefit: $138,613
- Payback period: 15 minutes (figuratively)
- Annual ROI: 4,731%
Use Case 3: Enterprise-Wide Rightsizing Initiative
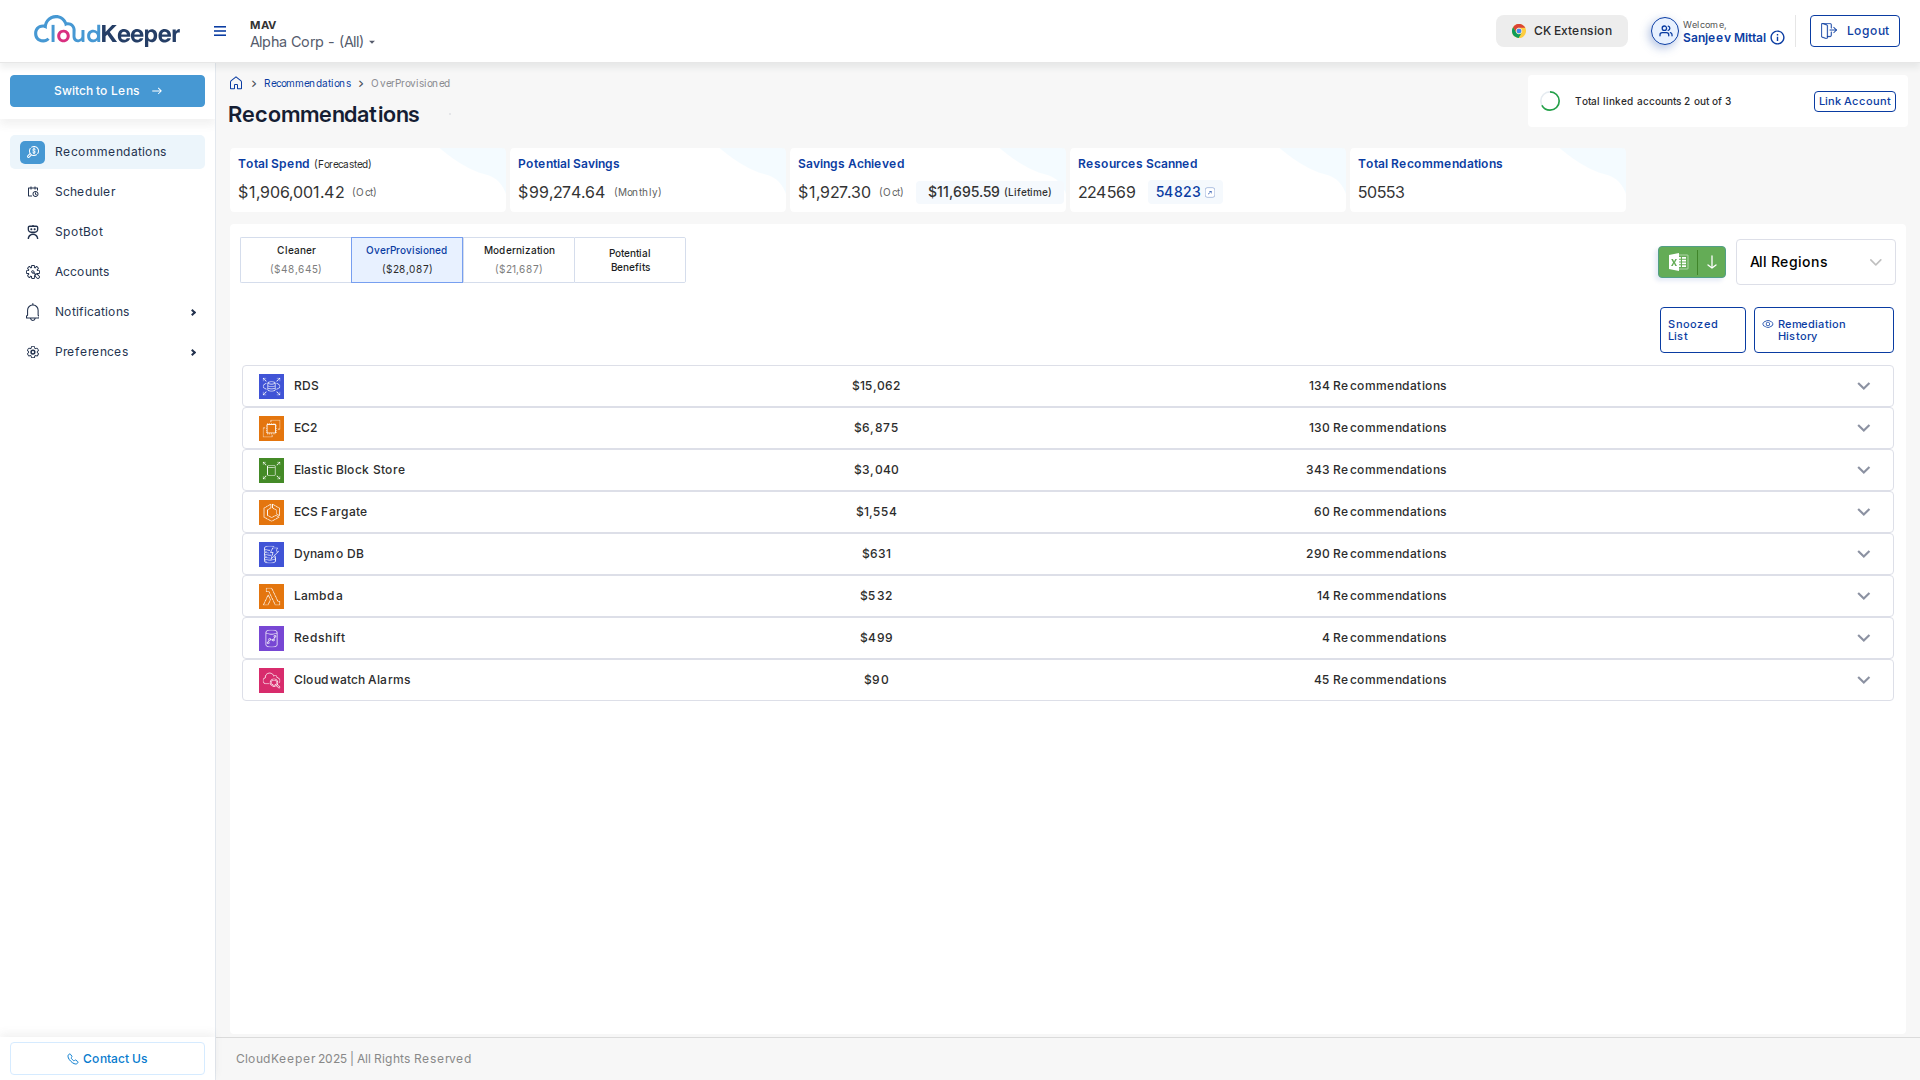
Challenge: A financial services company with $8M annual AWS spend suspected they were significantly overprovisioned but lacked tools to identify which instances to rightsize. Previous manual audit took 6 months and identified only $120K/year savings.
Solution with AWS Tuner OverProvisioned Recommendations:
-
Comprehensive Analysis: Tuner analyzed 2,847 EC2 instances across 23 AWS accounts
Analysis Period: 30 days
Metrics: CPU, Memory, Network, Disk I/O
Threshold: < 30% average utilization

Results:
- 916 overprovisioned EC2 instances
- 19 overprovisioned RDS databases
- 4 overprovisioned Redshift clusters

Potential Savings: $28,087/month ($337,044/year) -
Phased Implementation:
-
Phase 1 (Month 1-2): Non-production environments (low risk)
- 400 dev/staging instances rightsized
- Savings: $12,200/month
- Issues encountered: 3 instances (reverted in < 1 hour)
-
Phase 2 (Month 3-4): Production non-critical workloads
- 300 batch processing/reporting instances rightsized
- Savings: $9,800/month
- Issues encountered: 1 instance (performance acceptable after tuning)
-
Phase 3 (Month 5-6): Production critical workloads (with performance testing)
- 180 application servers rightsized carefully
- Savings: $6,500/month
- Issues encountered: 12 instances required different sizing (Tuner refined recommendations)
-
-
Continuous Optimization:
- Monthly re-analysis identifies new optimization opportunities
- Quarterly reviews refine utilization thresholds
- New workloads automatically analyzed within 30 days
Results:
- Total realized savings: $28,500/month ($342K/year) - exceeded initial projection
- Implementation time: 6 months (phased approach)
- Success rate: 97% of recommendations implemented successfully
- Performance issues: < 1% required rollback or adjustment
Avoided Costs:
- Previous manual audit cost: $180K (6 FTE-months @ $30K/month)
- Tuner implementation cost: $18K (6 months × $3K/month)
- Labor savings: $162K
ROI:
- Tool cost (6 months): $18,000
- Labor savings: $162,000
- Annual recurring savings: $342,000
- Total first-year benefit: $504,000
- First-year ROI: 2,700%
- Ongoing annual ROI: 1,233%
For FinOps & Cloud Cost Teams
Use Case 4: Spot Instance Adoption for Batch Workloads
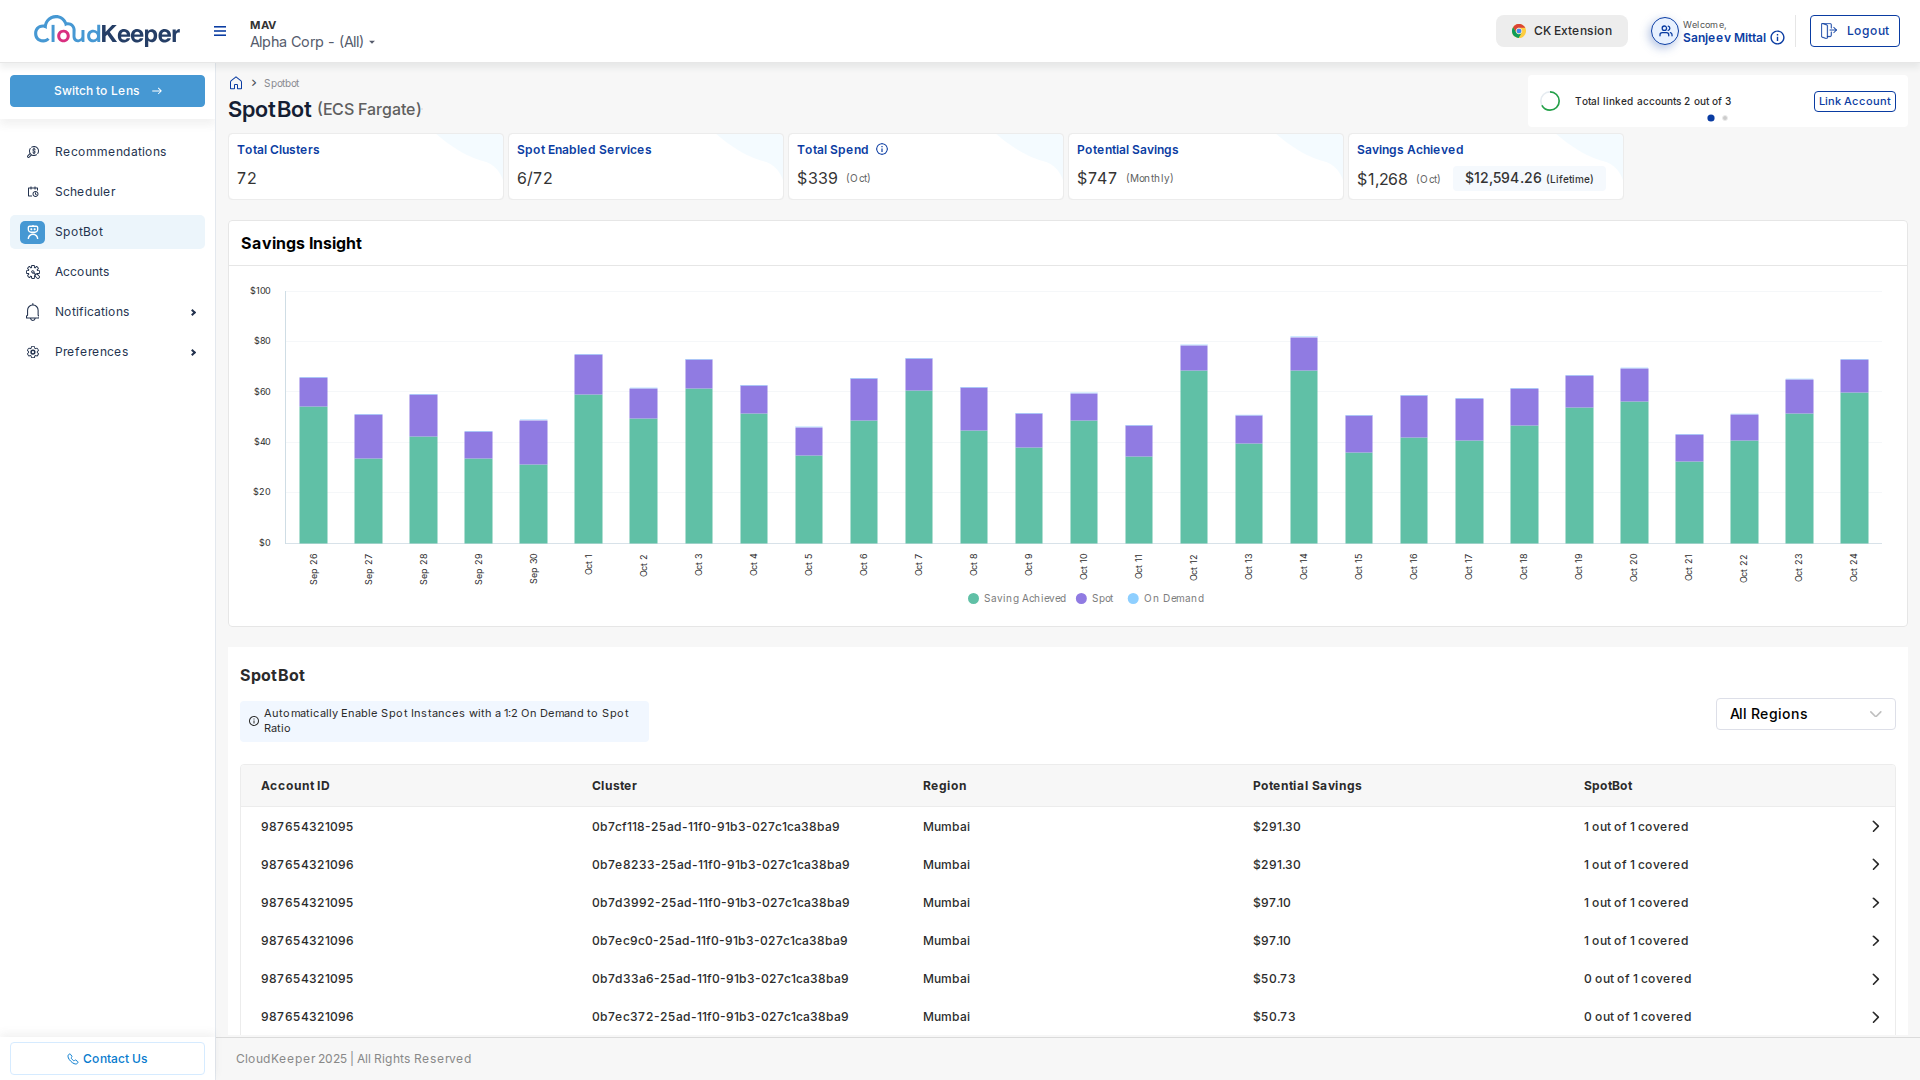
Challenge: A data analytics company was spending $420K/year on m5.4xlarge On-Demand instances for nightly ETL jobs that ran 4-6 hours and could tolerate interruptions.
Solution with AWS Tuner SpotBot:
-
Suitability Analysis:
- Workload: Nightly ETL (4-6 hours)
- Fault tolerance: Checkpointing enabled
- Interruption handling: 2-minute notice → graceful shutdown
- Verdict: Excellent spot candidate
-
Spot Strategy Implementation:
Instance Mix:
- m5.4xlarge (On-Demand): $0.768/hr
- m5.4xlarge (Spot avg): $0.230/hr (70% discount)

Diversification:
- m5.4xlarge (primary)
- m5a.4xlarge (AMD, same specs)
- m6i.4xlarge (newer generation)
- Spread across 3 availability zones

Allocation Strategy: capacity-optimized -
Interruption Handling:
- Implemented EC2 Spot Instance Interruption Notice monitoring
- Checkpointing every 15 minutes
- Resume from checkpoint if interrupted (< 1% of runs)
Results:
- Monthly savings: On-Demand $11,520 → Spot $3,450 = $8,070/month saved
- Annual savings: $96,840
- Interruption rate: 0.8% (well below 5% threshold)
- Completion time: Same as On-Demand (interruptions rare)
Extended to Other Workloads:
- CI/CD pipelines: $32K/year saved
- Machine learning training: $87K/year saved
- Data processing: $54K/year saved
- Total spot savings: $269,840/year
ROI:
- Implementation effort: 2 weeks engineering time
- Annual savings: $269,840
- Payback period: 6 days
- Annual ROI: 8,894% (amortized)
Use Case 5: Reserved Instance & Savings Plan Optimization
Challenge: An e-commerce platform with $4.5M annual EC2 spend was 100% On-Demand, missing out on commitment-based discounts. Finance wanted to commit but Engineering feared lock-in and changing requirements.
Solution with AWS Tuner Potential Benefits Recommendations:
-
Usage Analysis:
Stable Workloads (90+ days consistent):
- Web servers: 80 m5.large (24/7)
- API servers: 120 c5.2xlarge (24/7)
- Database: 40 r5.xlarge (24/7)

Variable Workloads:
- Autoscaling: 50-200 instances (varies)
- Batch jobs: Spot instances (already optimized) -
Hybrid Commitment Strategy:
-
1-year Compute Savings Plans (most flexible):
- Cover baseline of 180 instances (75% of stable workload)
- Applies across instance families
- Hourly commitment: $120/hour
- Savings: 66% vs. On-Demand
-
3-year EC2 Instance Savings Plans (highest discount):
- Cover database tier (most stable)
- 40 r5.xlarge instances
- Savings: 72% vs. On-Demand
-
Keep On-Demand for:
- Autoscaling burst capacity
- New workload testing
- Short-term projects
-
-
Safety Mechanisms:
- Commit to 75% of baseline (not 100%) to allow flexibility
- Monthly review: If stable workload increases, purchase more SPs
- If workload decreases: SP automatically applies to other compute
Results:
-
Compute Savings Plans (1-year):
- Commitment: $120/hr × 730 hrs/month = $87,600/month
- On-Demand equivalent: $264,000/month
- Savings: $176,400/month
-
EC2 Instance Savings Plans (3-year):
- Commitment: 40 instances × $0.086/hr × 730 hrs = $2,510/month
- On-Demand equivalent: $8,960/month
- Savings: $6,450/month
-
Total monthly savings: $182,850
-
Annual savings: $2,194,200
Flexibility Maintained:
- Autoscaling still works (bursts use On-Demand)
- New instance types automatically covered by Compute SP
- No stranded commitments
ROI:
- Zero upfront payment (pay-as-you-go SP)
- Commitment: $90,110/month
- Savings vs. On-Demand: $182,850/month
- Net benefit: $92,740/month
- Annual net benefit: $1,112,880
- ROI: 102.8% (savings exceed commitment cost)
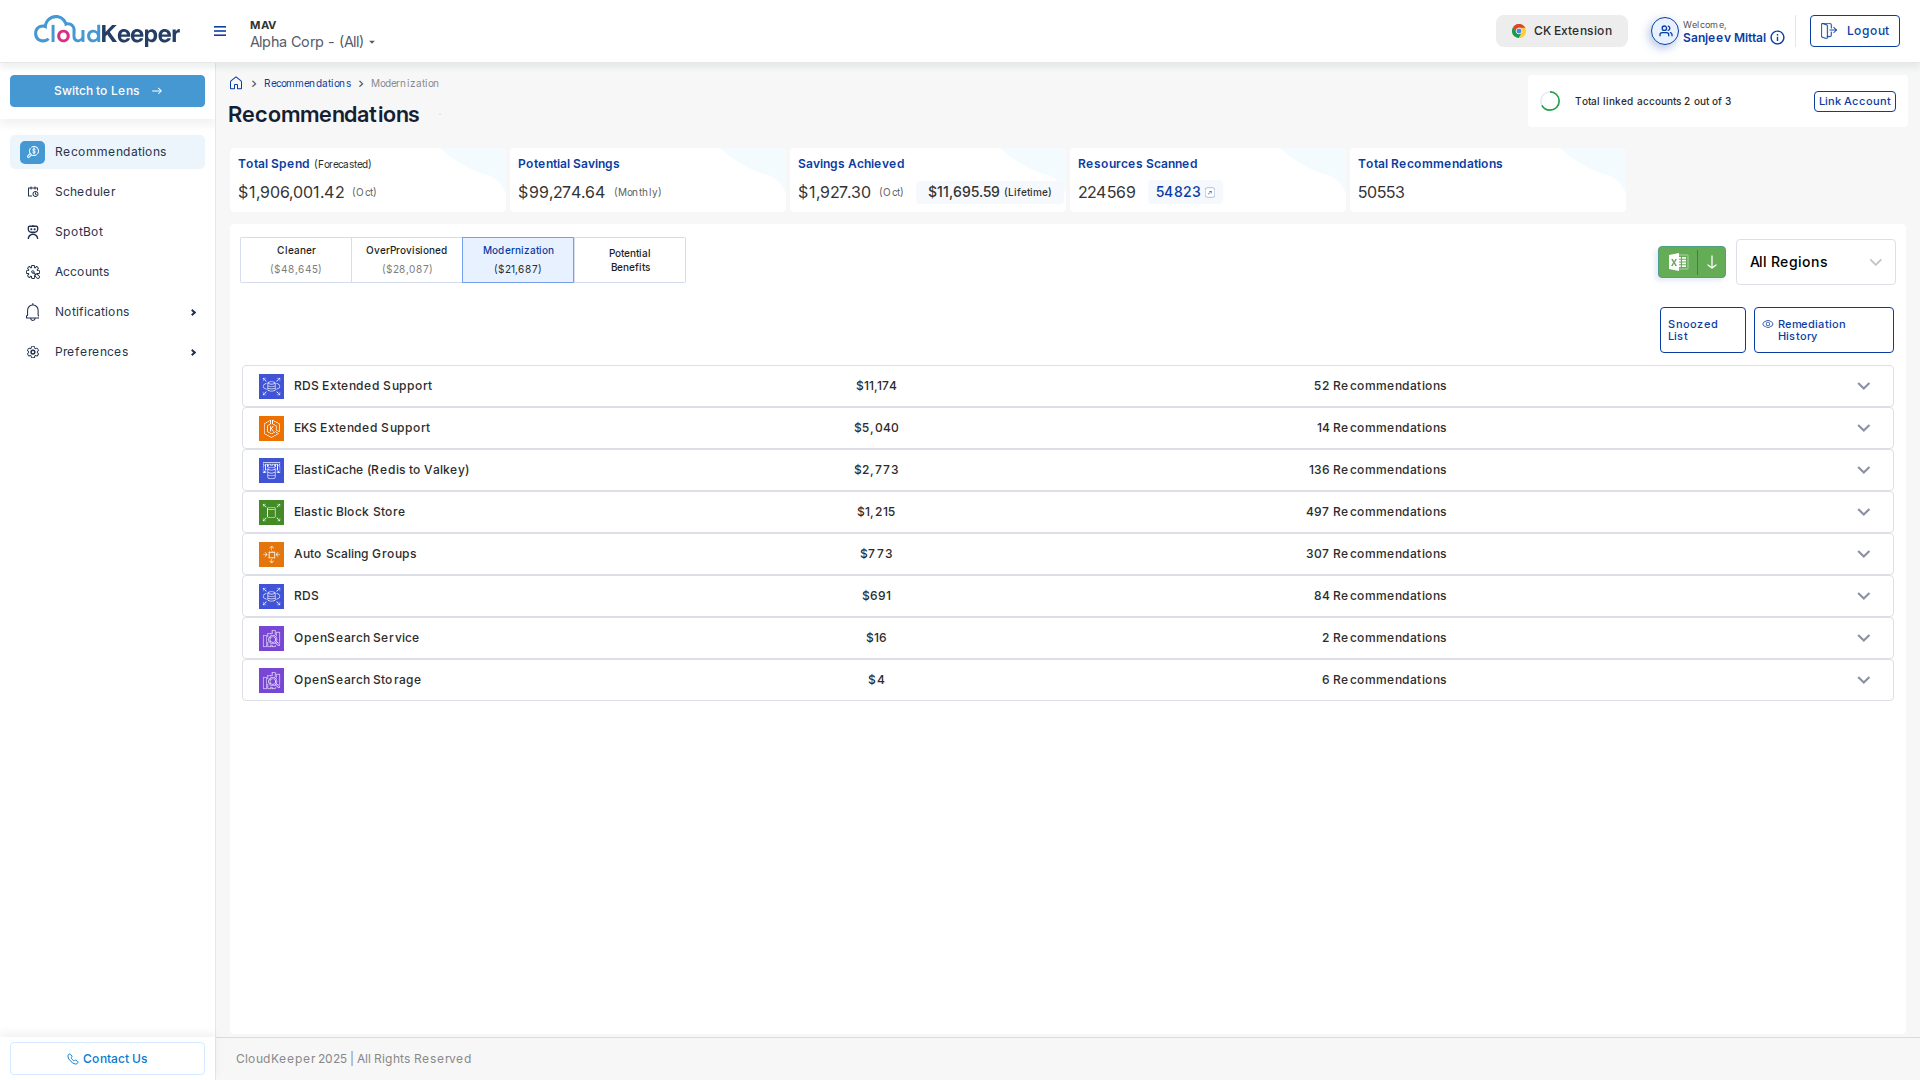
Use Case 6: Modernization to Avoid Extended Support Fees
Challenge: A healthcare company running 50 MySQL 5.7 RDS databases was facing AWS Extended Support fees of 50% on top of regular instance costs, adding $78K/year starting February 2024.
Solution with AWS Tuner Modernization Recommendations:
-
Extended Support Impact:
Current State:
- 50 MySQL 5.7 RDS instances
- Average cost: $13,000/month
- Extended Support (50%): +$6,500/month (starting Feb 2024)
- Total: $19,500/month -
Upgrade Strategy:
- Target: MySQL 8.0 (standard support until Feb 2026)
- Risk: Application compatibility testing required
- Timeline: 6-month phased migration
-
Implementation:
-
Month 1: Test environment MySQL 5.7 → 8.0 (5 databases)
- Identified 3 application compatibility issues
- Fixed SQL syntax incompatibilities
-
Month 2-3: Development & staging environments (15 databases)
- Validated application behavior
- Performance testing (minor improvements)
-
Month 4-6: Production databases (30 databases, 5/month)
- Blue-green deployment strategy
- Zero downtime migrations
- Rollback plan for each
-
Results:
- Avoided extended support fees: $6,500/month ($78K/year)
- Performance improvement: 8-15% faster queries (unexpected benefit)
- Security improvement: 3 years additional security patches
- Future-proofing: Extended standard support until 2026
Costs:
- Engineering effort: 3 months (1 FTE) = $45K
- Testing effort: 2 months (0.5 FTE) = $15K
- Total implementation cost: $60K
ROI:
- Implementation cost: $60K
- Annual savings: $78K (avoided extended support)
- Payback period: 9.2 months
- 3-year ROI: 290% ($234K saved over 3 years)
For Engineering & DevOps
Use Case 7: Developer-Friendly Cost Optimization with Browser Extension
Challenge: An engineering team had no visibility into cost implications when launching resources. Tuner recommendations existed but developers never logged into the cost management platform.
Solution: AWS Tuner Browser Extension
-
Contextual Recommendations:
- Developer viewing EC2 instance in AWS Console
- Extension shows inline recommendation:
💡 Tuner Recommendation
Current: m5.2xlarge ($280.32/month)
CPU Utilization: 12%

Recommended: m5.large ($70.08/month)
Savings: $210.24/month

[Implement] [Snooze] [Dismiss]
-
One-Click Implementation (for safe recommendations):
- Creates ticket in Jira
- Schedules change during maintenance window
- Tracks implementation status
-
Education:
- Developers learn cost-conscious decisions in real-time
- Cost awareness becomes part of culture
- "Shift-left" cost optimization to development phase
Results:
- Adoption: 85% of engineering team installed extension (vs. 12% who logged into portal)
- Recommendations implemented: 4x increase
- Developer satisfaction: "Helpful, not intrusive" feedback
- Cultural shift: Cost optimization became part of code review process
Cost Savings:
- Before extension: $18K/month optimizations implemented
- After extension: $72K/month optimizations implemented
- Incremental savings: $54K/month
For Enterprise Architects
Use Case 8: Multi-Cloud Optimization (AWS + GCP)
Challenge: A global enterprise with $12M annual cloud spend across AWS ($8M) and GCP ($4M) needed unified optimization across both platforms.
Solution with AWS Tuner (Multi-Cloud Support):
-
AWS Optimization:
- Cleaner: $142K/year
- OverProvisioned: $298K/year
- Scheduler: $420K/year
- Spot: $186K/year
- Total AWS: $1,046K/year
-
GCP Optimization (9 job types):
- Idle Compute Instances
- Idle Cloud SQL databases
- Idle Persistent Disks
- Idle Static IPs
- Idle Load Balancers
- Total GCP: $387K/year
-
Unified Dashboard:
- Single pane of glass for both clouds
- Consistent recommendation format
- Prioritized by savings across both platforms
Results:
- Combined savings: $1,433K/year (11.9% of total cloud spend)
- Operational efficiency: 1 tool instead of 2
- Consistent policies: Same optimization thresholds across clouds
Industry-Specific Use Cases
Startups & Scale-ups
Profile: $100K-$500K monthly AWS spend, high growth, limited FinOps resources
Key Challenges:
- Growing too fast to manually optimize
- Limited engineering bandwidth for cost work
- Need to preserve runway (cash efficiency critical)
Tuner Solutions:
- Automated Optimization: No manual work required
- Scheduler: Dev/staging environments off nights/weekends (40% savings)
- Quick Wins: Cleaner recommendations implemented in days
Typical Results:
- 15-25% cost reduction in first 90 days
- 3-6 month runway extension
- Zero engineering time required
Enterprise (Fortune 500)
Profile: $10M+ annual AWS spend, multiple accounts, strict compliance requirements
Key Challenges:
- Hundreds of AWS accounts across divisions
- Compliance and security requirements
- Cross-account visibility and governance
Tuner Solutions:
- Multi-Account Management: Centralized optimization across all accounts
- Role-Based Access: Read-only IAM roles for security
- Approval Workflows: Finance approval before implementation
- Audit Trail: Complete history for compliance
Typical Results:
- 8-15% cost reduction
- $1M+ annual savings
- Improved governance and chargeback accuracy
SaaS Companies
Profile: AWS costs as % of revenue (COGS), investor scrutiny on unit economics
Key Challenges:
- Cost per customer must decrease as scale increases
- Gross margin pressure
- Board and investor questions on cloud efficiency
Tuner Solutions:
- Continuous Optimization: Monthly savings compound over time
- Rightsizing: Reduce compute costs per transaction
- Spot Instances: Background jobs at 70% discount
Typical Results:
- 12-20% cost reduction
- Improved unit economics (cost/customer decreases)
- Better gross margins → higher valuation
ROI Calculator & Business Case
ROI Formula
Annual Savings = (Cleaner + OverProvisioned + Scheduler + Spot + Modernization)
Annual Cost = $36,000 (AWS Tuner Platform)
Net Annual Benefit = Annual Savings - Annual Cost
ROI = (Net Annual Benefit / Annual Cost) × 100%
Conservative Estimate
Assumptions (conservative):
- $1M annual AWS spend
- 5% savings from cleaner recommendations
- 3% savings from rightsizing
- 5% savings from scheduler (non-prod only)
- 2% savings from modernization
Calculation:
Cleaner:         $1M × 5% = $50K
Rightsizing:     $1M × 3% = $30K
Scheduler:       $1M × 5% = $50K
Modernization:   $1M × 2% = $20K
───────────────────────────────
Total Savings:   $150K/year

Annual Cost:     $36K
Net Benefit:     $114K
ROI:             317%
Payback Period:  2.9 months
Aggressive Estimate
Assumptions (based on demo and case studies):
- $1M annual AWS spend
- 12% savings from cleaner recommendations
- 8% savings from rightsizing
- 15% savings from scheduler
- 5% savings from modernization
- 10% savings from spot instances
Calculation:
Cleaner:         $1M × 12% = $120K
Rightsizing:     $1M × 8% = $80K
Scheduler:       $1M × 15% = $150K
Modernization:   $1M × 5% = $50K
Spot:            $1M × 10% = $100K
────────────────────────────────
Total Savings:   $500K/year

Annual Cost:     $36K
Net Benefit:     $464K
ROI:             1,289%
Payback Period:  0.9 months
Enterprise Scale ($10M+ annual AWS spend)
Calculation:
Conservative (13%): $10M × 13% = $1.3M/year
Aggressive (20%):   $10M × 20% = $2.0M/year

Annual Cost:        $36K
Net Benefit:        $1.264M - $1.964M
ROI:                3,411% - 5,356%
Payback Period:     10-17 days
Summary
Key Value Propositions
- Rapid ROI: Payback period typically < 3 months
- Automated Discovery: Find waste without manual audits
- Continuous Optimization: Ongoing savings compound over time
- Zero Risk: Read-only access, no impact on operations
- Proven Results: 15-35% cost reduction typical
Typical Savings Breakdown
| Category | Savings Range | Implementation Effort |
|---|---|---|
| Cleaner | 5-12% | Low (automated) |
| OverProvisioned | 3-8% | Medium (testing required) |
| Scheduler | 5-15% | Low (tag-based) |
| Spot Instances | 5-15% | Medium (workload modification) |
| Modernization | 2-5% | High (migrations) |
| Total | 15-35% | Varies |
Next Steps
- Getting Started Guide
- Architecture Deep Dive
- Contact Sales for custom ROI analysis